Within the Internal Quality Control process, knowledge of the Westgard Multiple Rules is essential as a factor responsible for guaranteeing the results of clinical analyzes.
Multiple rules represent the fifth step of the "Internal Quality Control (IQC) Journey", a nine-step system to ensure that analytical processes function correctly and results are delivered safely.
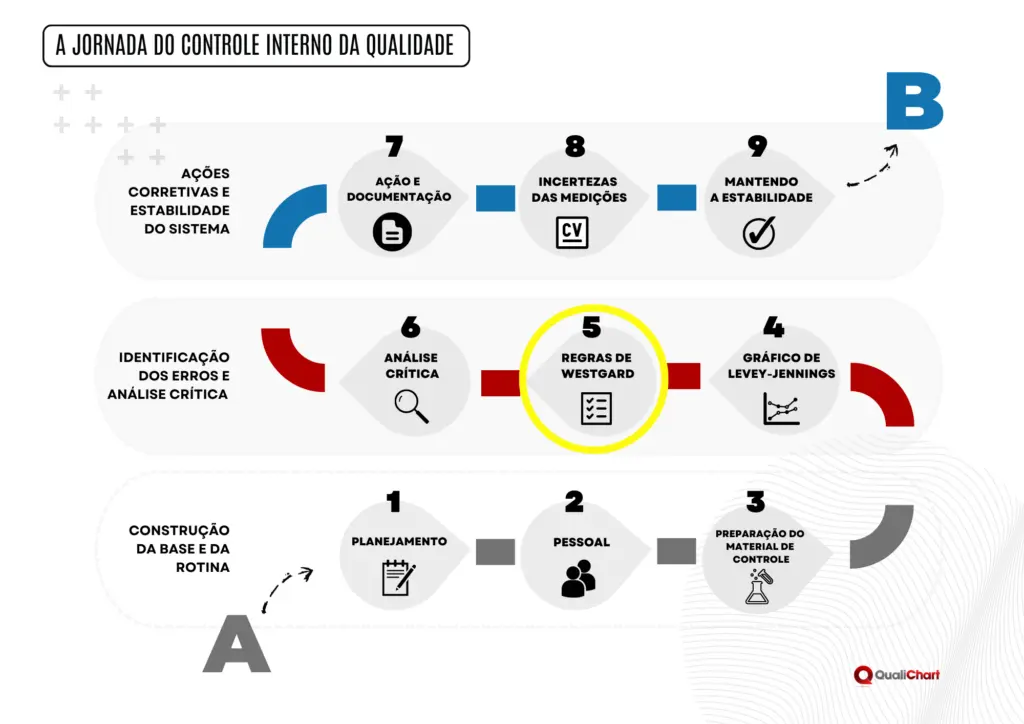
The IQC journey is an online guide that clearly and simply shows the steps necessary to face the challenges of internal quality control, such as validating control daily, performing critical analyzes correctly, applying multiple rules and managing the team and staff turnover.
If you don't already know the steps, you can access our guide by clicking here and have access to all the information necessary to successfully follow the IQC journey.
Therefore, we will discuss the specific characteristics and behaviors of Westgard Rules below:
Westgard Rules
As Westgard Multiple Rules are used to interpret results in the Internal Quality Control (IQC). To this end, a combination of decision criteria is used, with the aim of noticing inappropriate behavior in one or more analytical runs. In general, the form most used in describing rules is described by Westgard is given by indicating the number of times a situation occurs and the limit on the control chart.
Therefore, these rules help to understand the nonconformities, as well as clarify information about the type of error presented, which can be systematic or random, thus enabling the root cause of the problem to be revealed.
However, there must always be the professional's judgment as to which set of rules best applies to different analytical systems.
How the rules are presented
Several rules can be used individually or in combination. The professional must choose the approach best suited to controlling imprecision in the analytical system concerned. Ideally, the quality manager should specify a set of rules that improves the ability to detect problems. Rules are often used with two control levels (N = 2), but also with three or four levels. Many rules can be applied to a single control level. Using only one level greatly limits sensitivity to errors and the ability to identify the cause of a nonconformity.
Knowledge of system behavior is an important factor for the specifications of control strategies. Proper use of control rules improves the rate of error detection, enabling a lower false rejection rate.
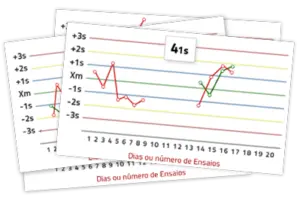
See the figure on the side and its explanations, which follow Dr. Westgard's original creation. In drawings and figures it is practical to represent them with fonts of different sizes, but in text and on computers we prefer to adopt another notation. So, we will represent it with the ‘:’ separator, making this rule 1:2s. We developed this way of representing in 1998 and it has been well understood and adopted by laboratory professionals.
The letter s comes from the English STANDARD, which makes up the term “standard deviation”, in Portuguese. The first digit represents the number of control results that exceed the specified tolerance limit. In the example cited, we can easily understand that this is the occurrence of a result that was plus or minus two standard deviations in relation to the reference average. The second digit means that the tolerance limit established for the control was 2SD, above or below the average. There will be a violation of this rule when the result exceeds this limit. The rules help us understand non-conformity and also provide information about the type of error, whether it is systematic or whether it is random. From this classification we can go through a list of possibilities, to find the root cause of the problem.
Description of control rules
As analytical systems have their own characteristics, a rule model that is most appropriate for each system must be adopted. Knowledge of systems behavior is an important factor for the specifications of control strategies. We will describe some of the most used multiple rules, representing in the Levey-Jennings graph the situation indicated by the rule.
Rule 1:2s
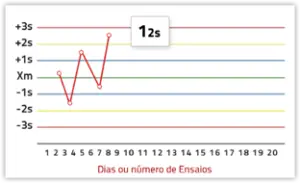
Alert Rule: represents the control rule where the value of one of the controls exceeds the limit of Xm ±2s. It does not imply rejection. The occurrence of 1:2s is the warning signal and indicates that additional inspections should be carried out on all data. In a manual system, the following rules apply to decide whether results can be accepted or should be rejected. In an automated system all rules are tested, because there are situations in which there is no violation of 1:2s and another rule indicates a systematic error. As an example, the 4:1s rule, or the 7T.
Rule 2:2s
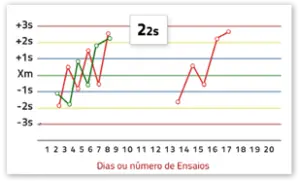
Rejection Rule: The rule is initially applied in the same batch for the values of 2 controls (2 levels). The results are not released when the values of 2 controls exceed the limits of + 2s or – 2s, on the same day. The rule can also be applied to 2 consecutive observations (2 days) for the same control. Violation indicates a systematic error.
Rule 1:3s
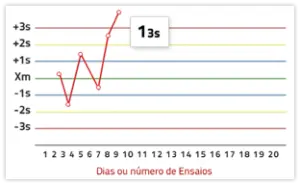
Rejection Rule: means that the results must be rejected because the value of one of the controls exceeds the limit of Xm ± 3s. This is a usual criterion or rejection threshold for the Levey-Jennings graph. Violation of this rule indicates an increase in the random error, but could eventually mean a systematic error of large dimensions.
Rule R:4s
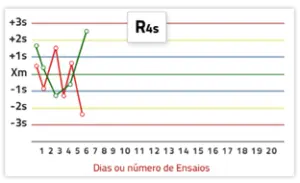
Rejection Rule: the values obtained must be rejected when the difference between the data from the 2 controls is greater than 4s, being applicable only when there are 2 levels installed. So when the value of one control exceeds +2s and the value of the other control exceeds -2s, each observation exceeds 2s, but in opposite directions, making a difference greater than 4s. It must be considered that the difference must be greater than 4s, even if a result does not exceed 2s. It is an indicator of the occurrence of random errors.
Rule 4:1s
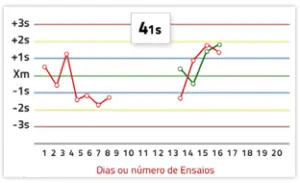
Rejection Rule: results must be rejected when 4 consecutive values of a control exceed the same limits i.e. Xm +1s or Xm 1s. These consecutive observations can occur with the values of one control and require observation for 4 consecutive days, or at two levels, in intersection with the values of the other control, which requires observation for 2 days. Violation indicates a systematic error.
Rule 7x
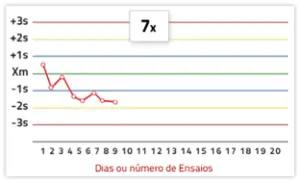
Rejection Rule: this rule is violated when the control values are on the same side of the average for 7 consecutive days, and it is not necessary for the limits of +-2s or +-3s to be exceeded. This rule is an indicator of the occurrence of a systematic error and indicates that the system has lost stability and that results obtained from patient samples must be rejected. Violation indicates incidence of systematic error.
Rule 7T
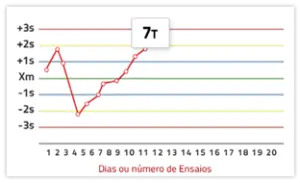
Rejection Rule: this rule is violated when the control values on 7 consecutive days show an increasing or decreasing trend, and it is not necessary for the limits of +-2s or +-3s to be exceeded. This rule indicates that the system has lost expected performance and that results obtained from patient samples should be rejected. Violation indicates incidence of systematic error.
10x Rule
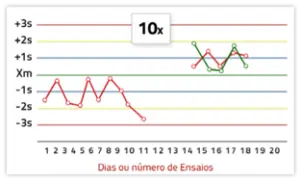
Rejection Rule: Results cannot be released when control values are on the same side of the average for 10 consecutive days. These observations can occur for the value of one control or for both controls, meaning observation for 10 or 5 days respectively (5 observations for level 1 and 5 for level 2).
In addition to the rules presented previously, in control environments, which include three materials (three levels of control), other rules can be applied. However, to work with this situation, a more detailed control protocol must be established, in which the quality manager defines this criterion for some specific analytical systems.
Rule 2_3:2s – occurs when 2 of three control materials have their results exceed the mean by 2 SD, more or less. Indicates rejection of the run.
3:1s Rule – occurs when 3 consecutive measurements exceed the mean value by 1 SD on the same side. Indicates rejection of the run.
6x Rule – when 6 consecutive measurements fall on the same side of the average. Indicates rejection of the run.
Control rules and error types
When violated, the control rules point to the type of error, contributing to the understanding of the problem and the search for the root cause. Classifying errors only as systematic and random, this correlation can be established:
Systematic errors: are highlighted by most of the rules, such as 2:2s, 4:1s, 5X, 7X, 7T and 10X. These errors are related to changes in the average value. Because they have a certain direction and are persistent, their causes are more easily found.
Random errors: are caused by different factors and due to their random characteristic, it becomes more difficult to find the root cause. They can be pointed out by the rules: 1:3s and R:4s. The 1:3s may eventually show a systematic error of large proportion, or magnitude.
The use of multiple rules must be periodically reevaluated for each analytical system and its modified set. Changes in the reagent and equipment may require adjustments, and rules must be specified that are sensitive to the type of error most likely at the time, in order to detect problems. The use of the same standard for all analytes, indiscriminately, should be avoided.
To help clinical laboratory professionals understand the Westgard Rules, Qualichart developed the eBook Multiple Rules of Internal Control, where you can find examples and interpretations. Each example has a comment with suggested actions for each rule, if violated, in addition to indicating the types of errors that occur during the internal quality control process.