What does the CV say?
The coefficient of variation expresses the standard deviation in relation to the mean: CV (%) = standard deviation / mean × 100. For a mean of 100 and a standard deviation of 2, the CV is 2%. This calculation makes the relative dispersion easier to read, but it depends on an appropriate scale and average.
Calculate an example
Form a comparable set
Do not indiscriminately mix control levels, lots, units or methods. Describe the period and conditions of the data, and investigate nonconforming results. The exclusion of a point must have documented justification, avoiding selecting only results that reduce the CV.
Follow the evolution
Compare periods with equivalent conditions and record reagent changes, calibration or maintenance. A smaller CV does not eliminate the possibility of bias: dispersion and systematic deviation need to be evaluated together.
The biological variation table helps you consult a source of imprecision specifications. Target selection must be justified by the laboratory, considering the method and clinical use.
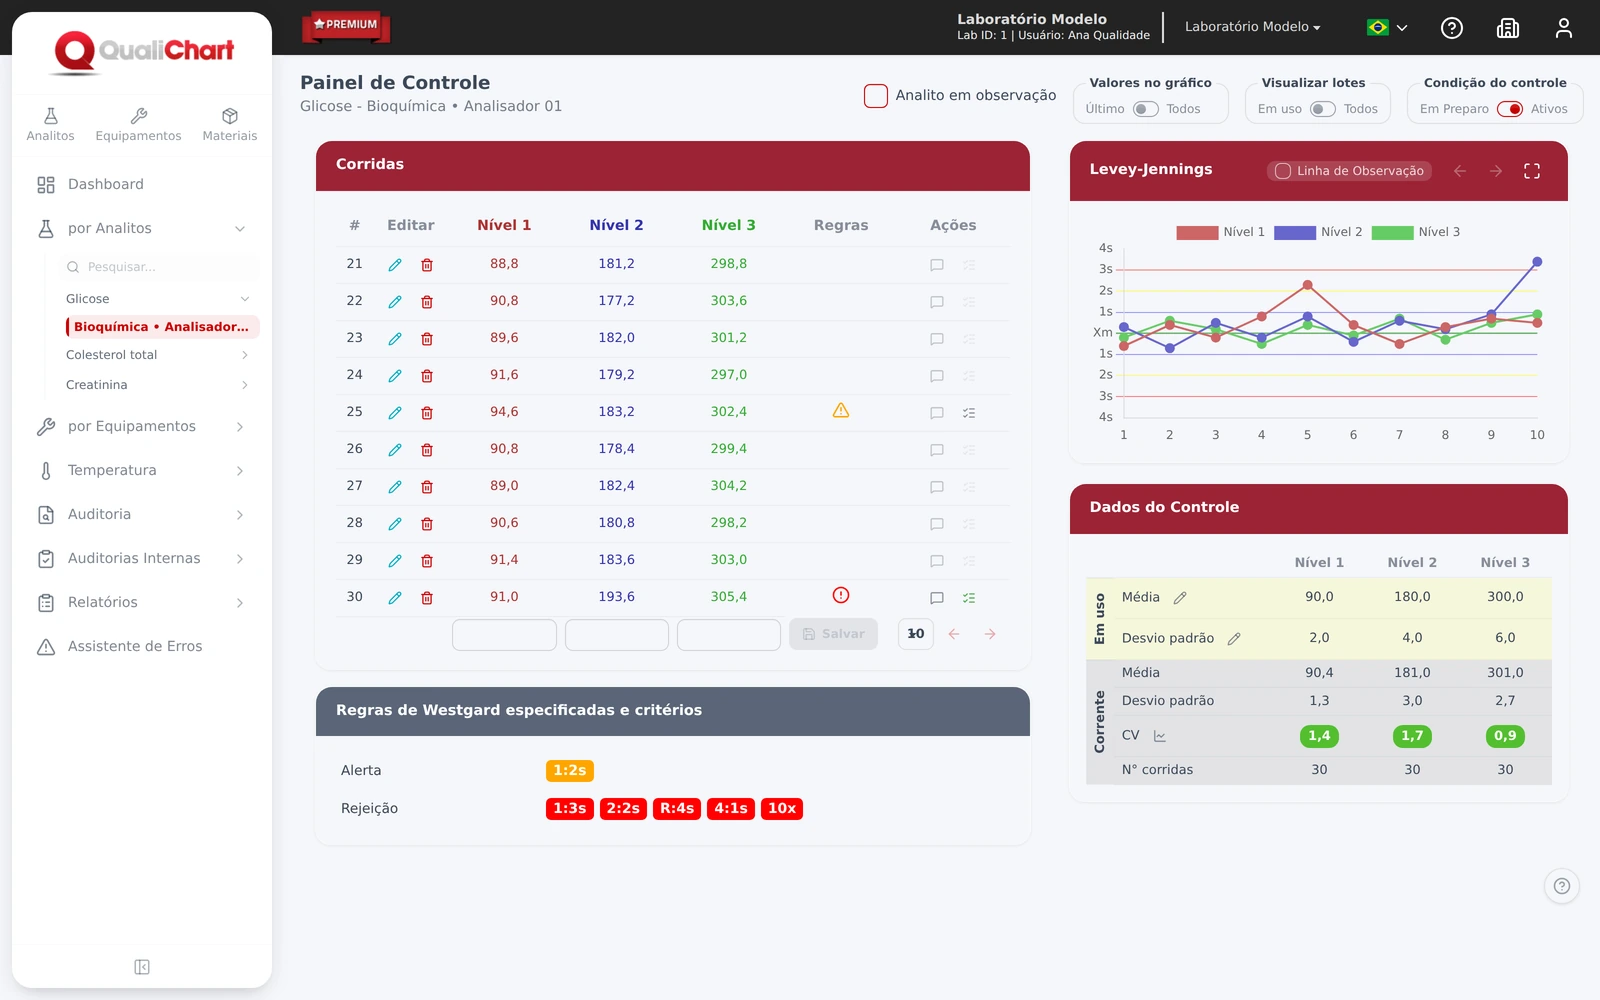
To observe behavior over time, see the Levey-Jennings graph. Reference: Westgard, precision data and control planning.
An example you can check
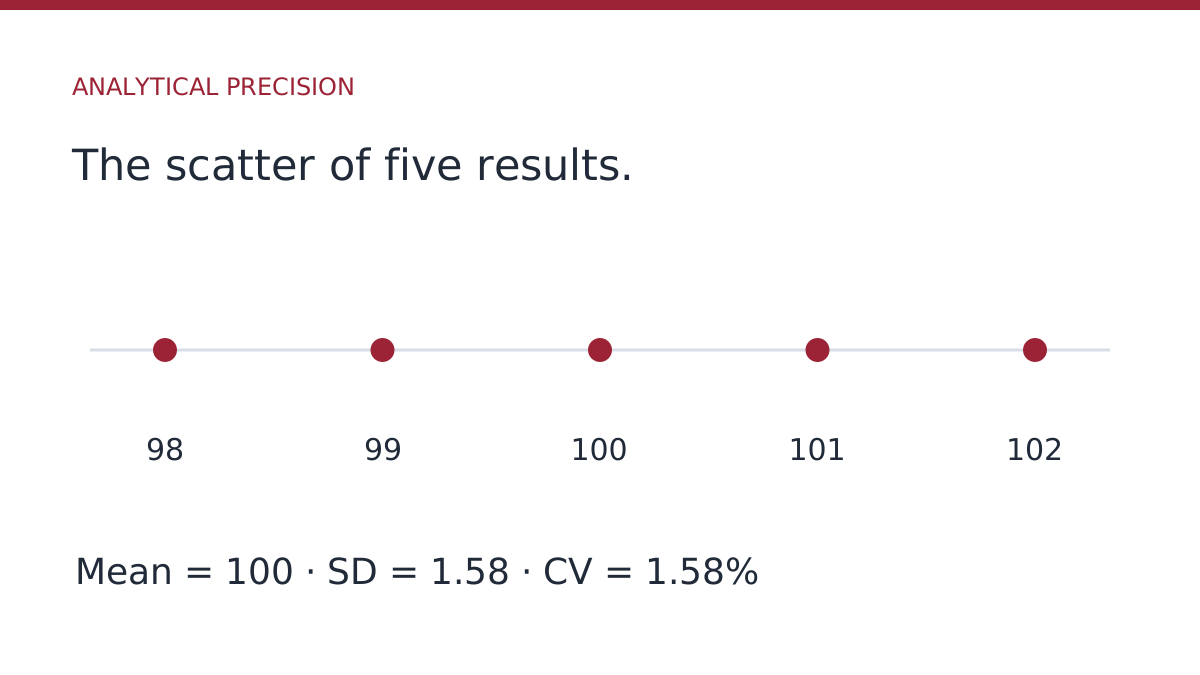
Consider five control teaching results: 98, 99, 100, 101 and 102 mg/dL. The average is 100 mg/dL. For the sample standard deviation, we sum the squares of the deviations in relation to the mean: 4 + 1 + 0 + 1 + 4 = 10. We divide by n − 1 = 4 and extract the root: SD ≈ 1.58 mg/dL. Therefore, CV ≈ 1.58%.
Five results serve to understand the account; do not constitute, in themselves, a sufficient study to establish the performance of a method. In the routine, select a representative period, identify batch and calibration changes, and document justified exclusions.
| Level | Mean | SD | CV |
|---|---|---|---|
| A | 100 mg/dL | 2 mg/dL | 2% |
| B | 200 mg/dL | 2 mg/dL | 1% |
CV allows you to express the dispersion in relation to the mean. Even so, it does not make different concentrations clinically equivalent. Close to zero, the ratio becomes unstable; In these cases, consider the absolute dispersion and suitability of the indicator.
What to check when CV increases
- Check the unit, decimal position and typing before interpreting the indicator.
- Separate levels and materials. Mixing concentrations can produce dispersion without analytical significance.
- Inspect the chart: a change in the mean within the period can increase the overall SD.
- See control preparation and conservation, maintenance, calibration and reagents.
- Record the adopted criteria and monitor performance after the intervention.
Low CV does not demonstrate absence of bias. A very reproducible set may remain far from the reference value. Combine the imprecision analysis with the external assessment and the chosen performance specification.