About the author

Silvio de Almeida Basques
Author of materials on internal quality control and information systems for laboratories.
Training and experience
Doctor, with residency and postgraduate degree from the Federal University of Minas Gerais and specialist title from the Brazilian Society of Clinical Pathology. Retired professor at the UFMG Faculty of Medicine.
Answer each of the questions presented, about the interpretation of Levey-Jennings graphs, for internal control.
Level 1 data, in pink; level 2, in blue.
CV = Coefficient of Variation; N1 = level 1; N2 = level 2
Exercise 1: Sodium - Ion Selective Electrode
CV: N1 = 2.5% | N2 = 2.0%
Features: Automation - Automatic Calibration - Two-level IQC
Method: Ion Selective Electrode
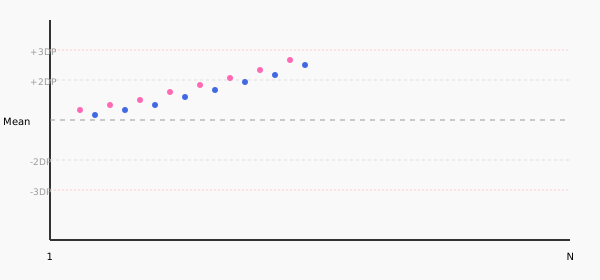
Observe both levels, identify the rules violated and propose causes to investigate and corrective actions. Level 1 in pink; level 2 in blue.
See exercise 1 comment
Trend up to 1:3s – increase of both levels
Systematic error
Electrode contamination, controls dehydration, problem with the calibrator.
Electrode cleaning and new calibration.
Exercise 2: Glucose – Enzymatic
CV: N1 = 4.37% | N2 = 3.24%
Features: Automation – IQC on two levels
Method: Enzymatic
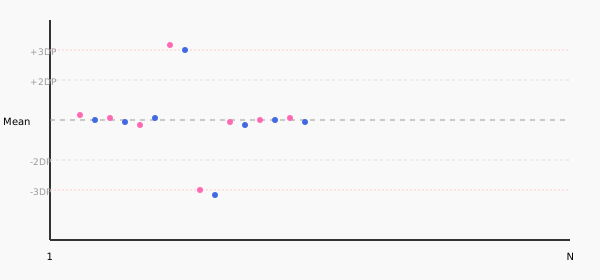
Observe both levels, identify the rules violated and propose causes to investigate and corrective actions. Level 1 in pink; level 2 in blue.
See exercise 2 comment
R:4s - Excessive variation between levels
Random error
Changing bottles between control levels, pipetting problem.
Repeat controls. Check bottle identification.
Exercise 3: Creatinine – Enzymatic
CV: N1 = 6.74% | N2 = 3.39%
Features: Automation – Dry Chemistry – IQC two levels
Method: Enzymatic with Dry Chemistry
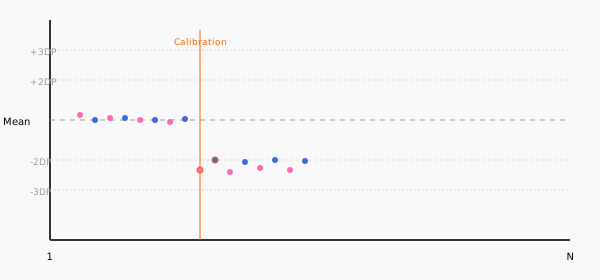
Observe both levels, identify the rules violated and propose causes to investigate and corrective actions. Level 1 in pink; level 2 in blue.
See exercise 3 comment
2:2s - Abrupt deviation from the average downwards (about half of the previous values)
Systematic error
Occurred after a calibration, with a new batch of calibrator. Problem with the value reported to the equipment.
Correct the calibrator value. Check documentation and reference values for the new batch.
Exercise 4: Alkaline Phosphatase
CV: N1 = 18.3% | N2 = 8.8%
Features: Automation, two-level IQC
Method: Enzymatic
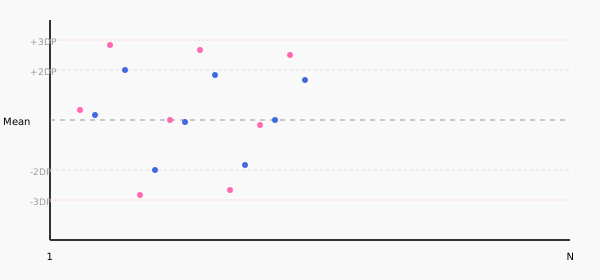
Observe both levels, identify the rules violated and propose causes to investigate and corrective actions. Level 1 in pink; level 2 in blue.
See comment on exercise 4
8x - 8 consecutive points (without violating 1:2s)
Systematic error
Change of Slide Generation, in this methodology. Change in reagent or equipment conditions.
Check the impact of deviation from the mean on the results. Consider adjusting the average. Evaluate passing the 8x rule for alert (not rejection).
Exercise 5: Urea - Enzymatic
Features: Automation – IQC on two levels
Method: Enzymatic
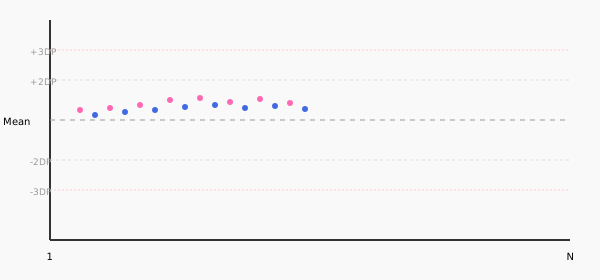
Observe both levels, identify the rules violated and propose causes to investigate and corrective actions. Level 1 in pink; level 2 in blue.
See comment on exercise 5
8x - 8 consecutive points (without violating 1:2s)
Systematic error
Change of Slide Generation, in this methodology. Change in reagent or equipment conditions.
Check the impact of deviation from the mean on the results. Consider adjusting the average. Evaluate passing the 8x rule for alert (not rejection).
Visual Interpretation of the Levey-Jennings Chart
The control chart is universally accepted as a valuable parameter for interpreting the variability of a measurement system.
Graph analysis is very helpful in understanding the variability of the results obtained from the materials and can now indicate whether there is randomness or whether there is a systematic error. Even in the preparation phase of Internal Quality Control, it is already possible to extract information by analyzing the graph.
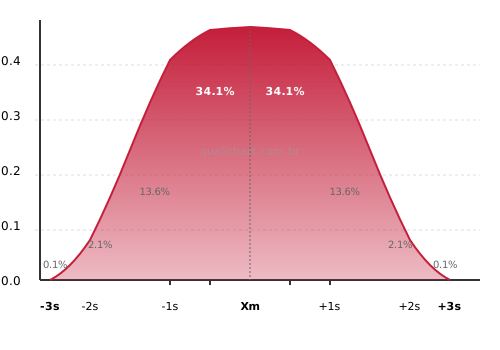
For a normal distribution in a stable system, the theoretical proportions are:
purified in a stable measurement system should have the following distribution:
68.26% data will sometimes be in the range of ± 1 SD
95.46% will sometimes be between ±2 SD
99.73% will sometimes be between ± 3 SD
Therefore, the data is expected to oscillate around the average, in the above proportion, without trends and without exaggerated distance from the central line.
It is the so-called Gaussian distribution.
Gaussian Distribution
Control Rules and Error Types
When violated, the rules point to the type of error, contributing to the understanding of the problem and the search for the root cause.
Systematic Errors
They are indicated by most rules, such as 2:2s, 4:1s, 5x, 7x, 7T and 10x. Indicate a constant change or trend in results.
Random Errors
They are indicated by 1:3s and R:4s. They indicate unpredictable variations in results. The 1:3s rule may eventually point out a systematic error of great proportion or magnitude.
Important observation: Systematic errors are more frequent in the practice of Internal Quality Control.
Did you like it? Share this content
Published May 2012