
Features
Everything QualiChart offers your laboratory.
From quantitative IQC to critical supplies, the modules follow the order of your daily routine. Choose a module to see what it does and a real screen from the system.
Quantitative IQC
From data entry to decision, on a single screen.
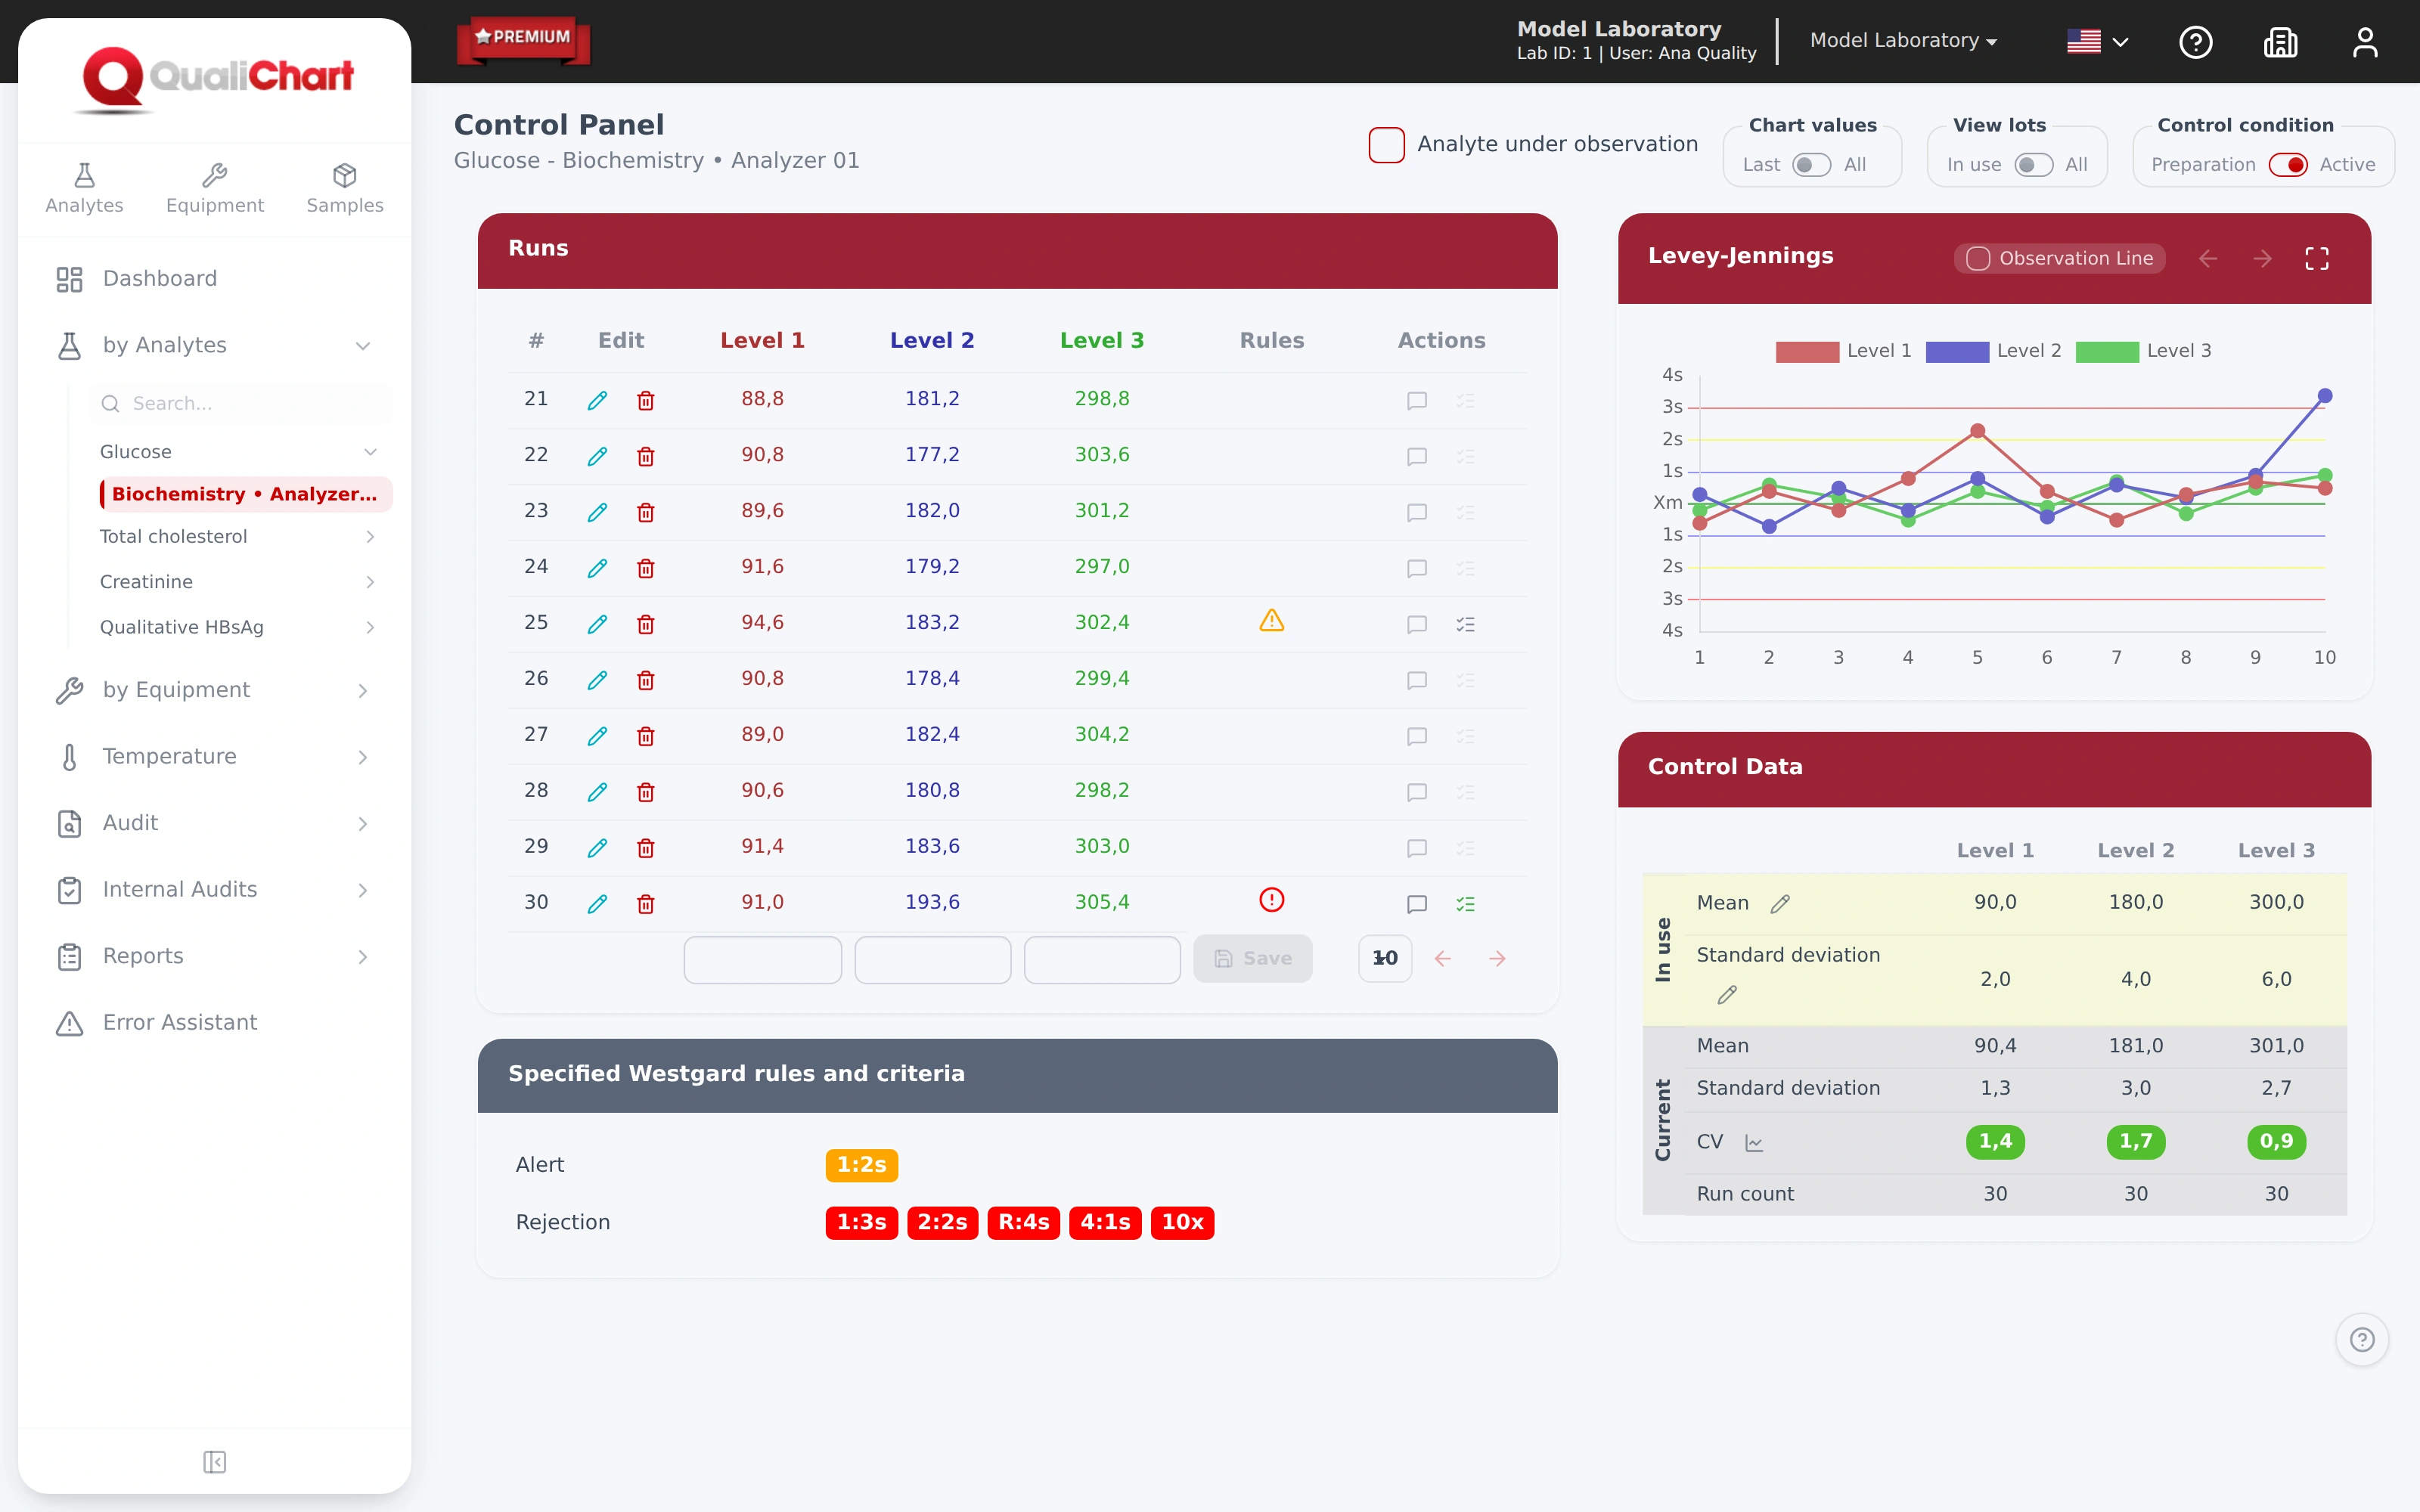
The control panel brings together the control runs, the Levey-Jennings chart and the control data for each level. Westgard rules evaluate every result as soon as it is saved.
- Levey-Jennings PlotUp to three levels per control, with the mean and SD in use and those calculated from the series.
- Westgard rules by analyteChoose whether each rule warns, rejects or is disregarded.
- Preparation and activationEach control starts in preparation and is activated after 20 runs per level, with a review of the mean and SD.
- Review and investigationCause and corrective action recorded on the rejected run, using the Error Assistant catalog.
- AI AssistantPossible causes and next steps to support the investigation. The decision rests with your team.
- Analytes under observationFlag the controls that need follow-up and find them on the dashboard.
Analytical sigma
Analytical performance in a single number.
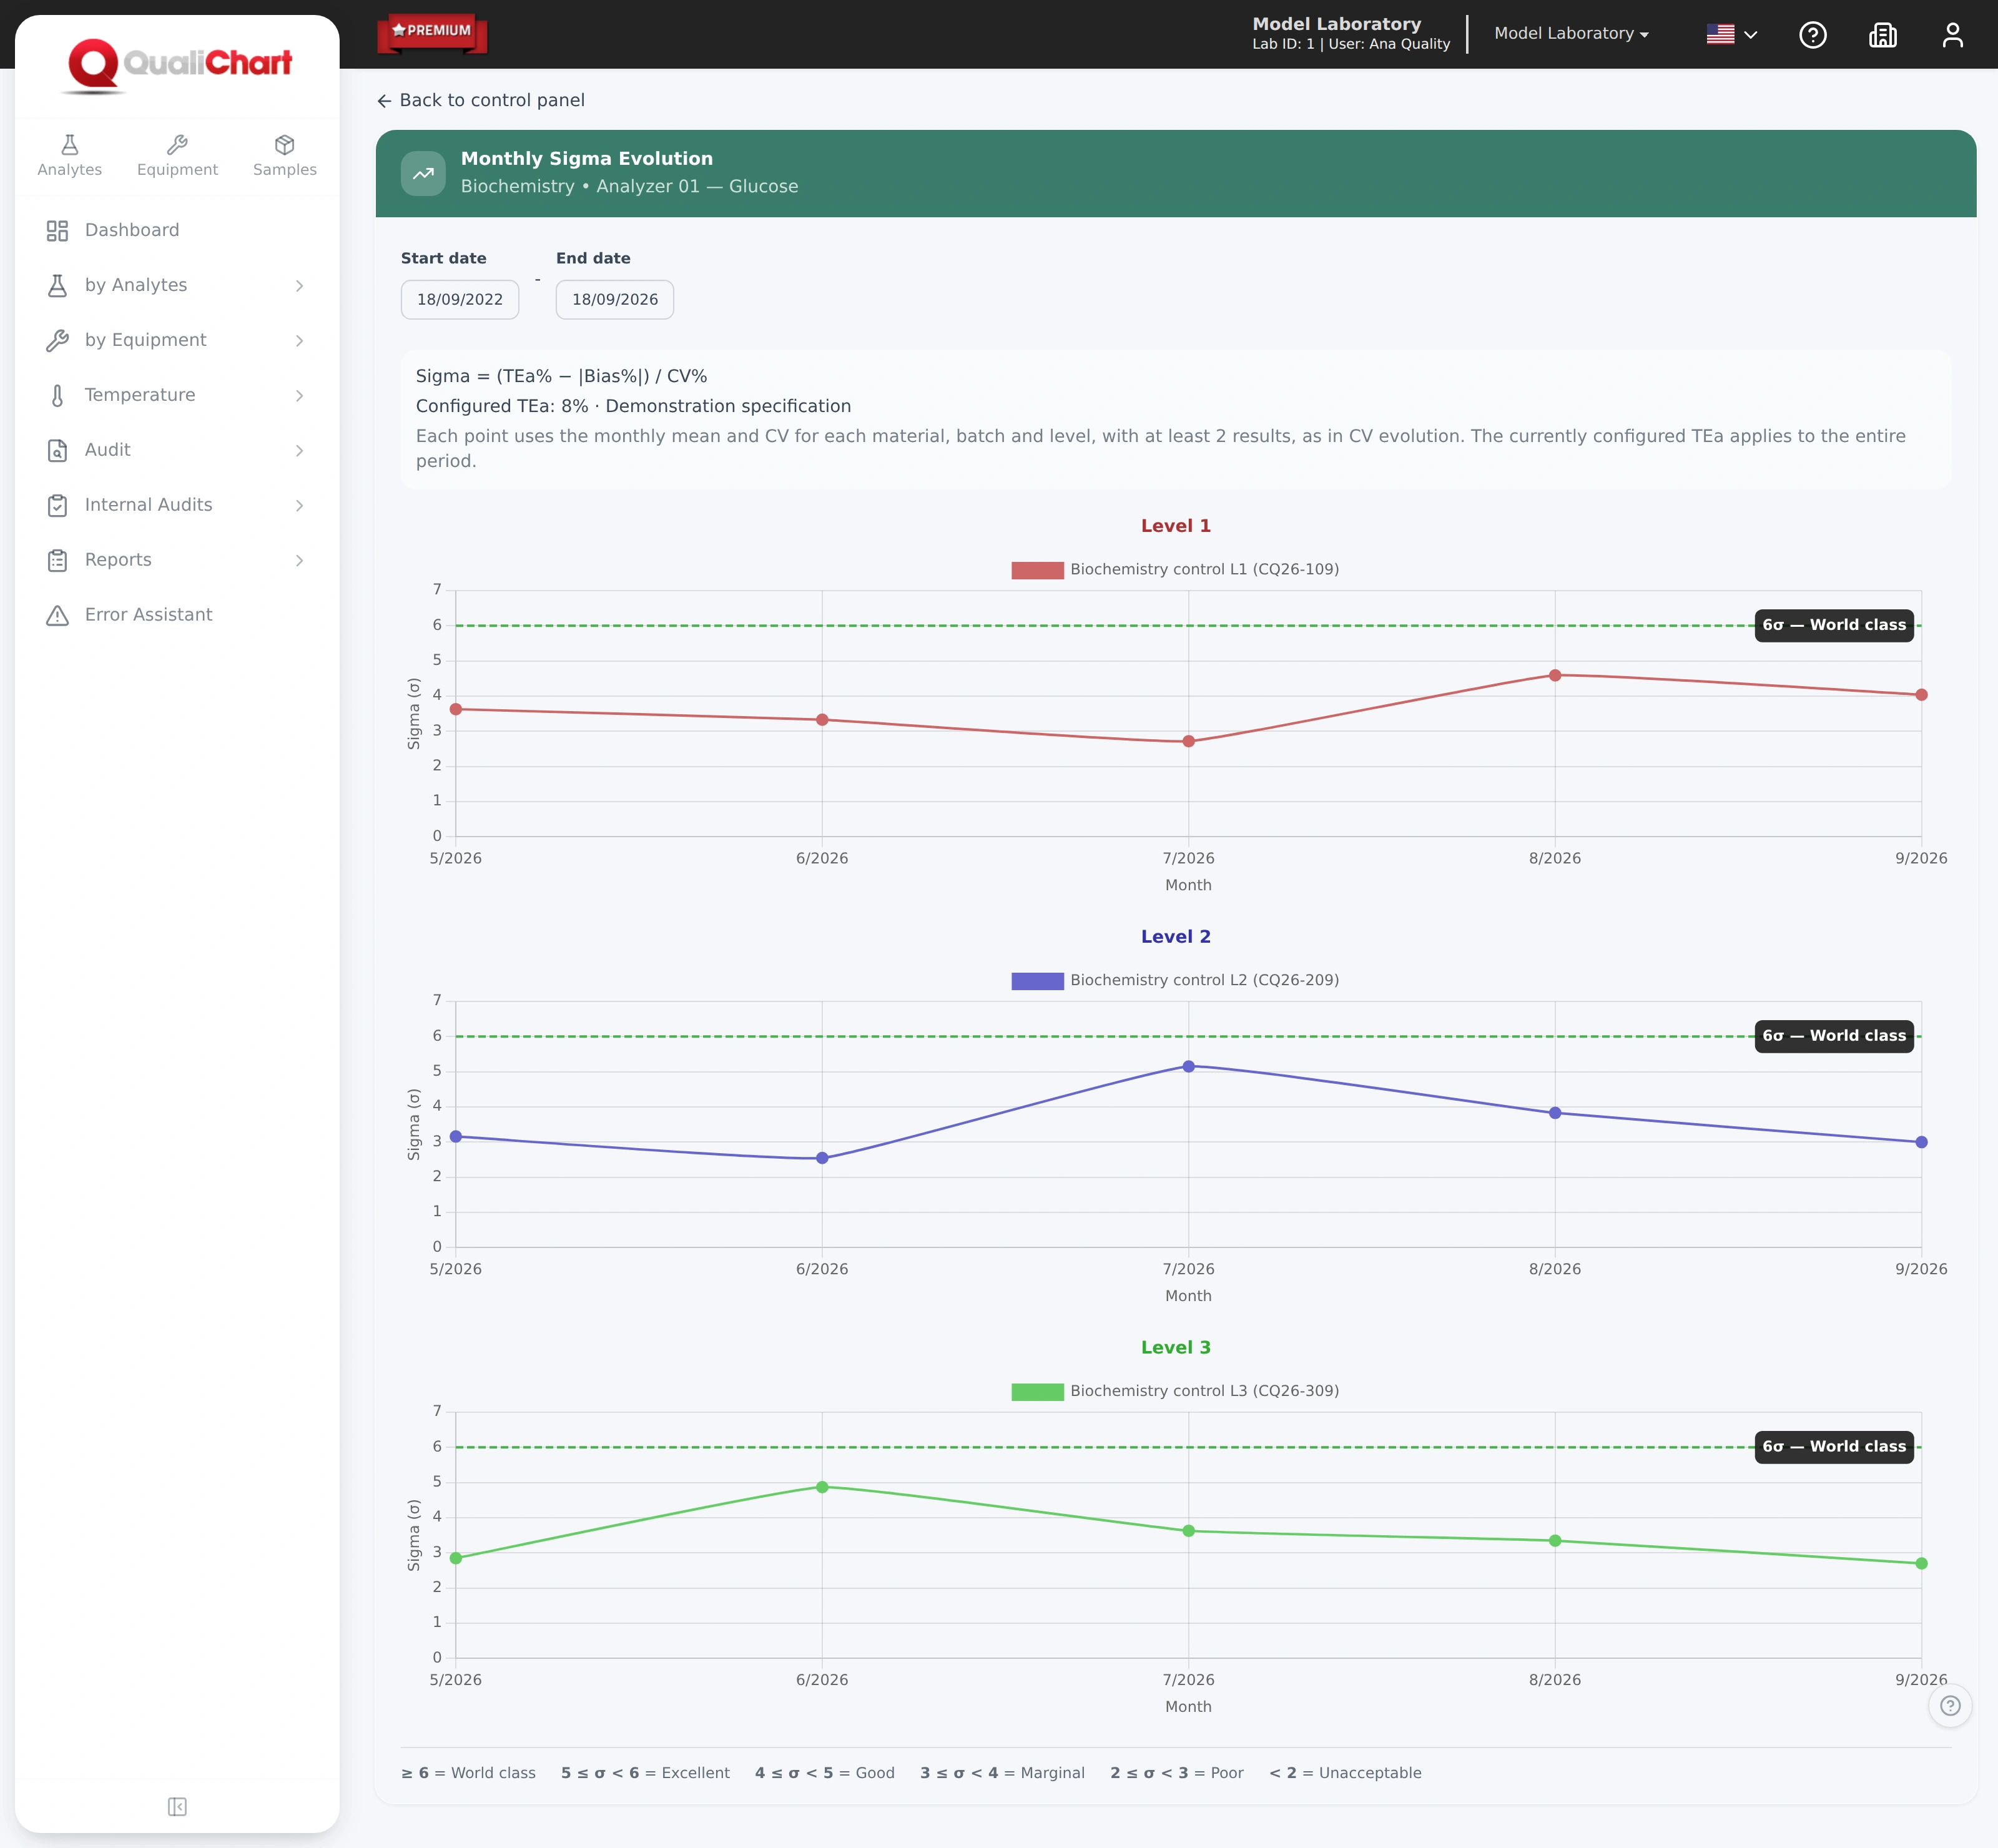
QualiChart calculates the sigma of each level using the TEa registered for the analyte, the bias against the package insert target and the cumulative CV: σ = (TEa% − |bias%|) / CV%.
- Sigma by level on the panelGraded from world class to unacceptable. When sigma cannot be calculated, the reason is shown.
- Percentage TEa, absolute TEa or bothRecord the source of the specification. With both limits, the larger one in the analyte unit applies.
- Monthly sigma evolutionOne chart per level, with one line per material lot and the 6σ threshold.
- CV evolutionThe CV for each month compared with the analyte's maximum allowable imprecision.
- Measurement uncertaintyStandard and expanded uncertainty (k=2) estimated from IQC data, in a report.
Qualitative and semi-quantitative
Also for results that are not numbers.
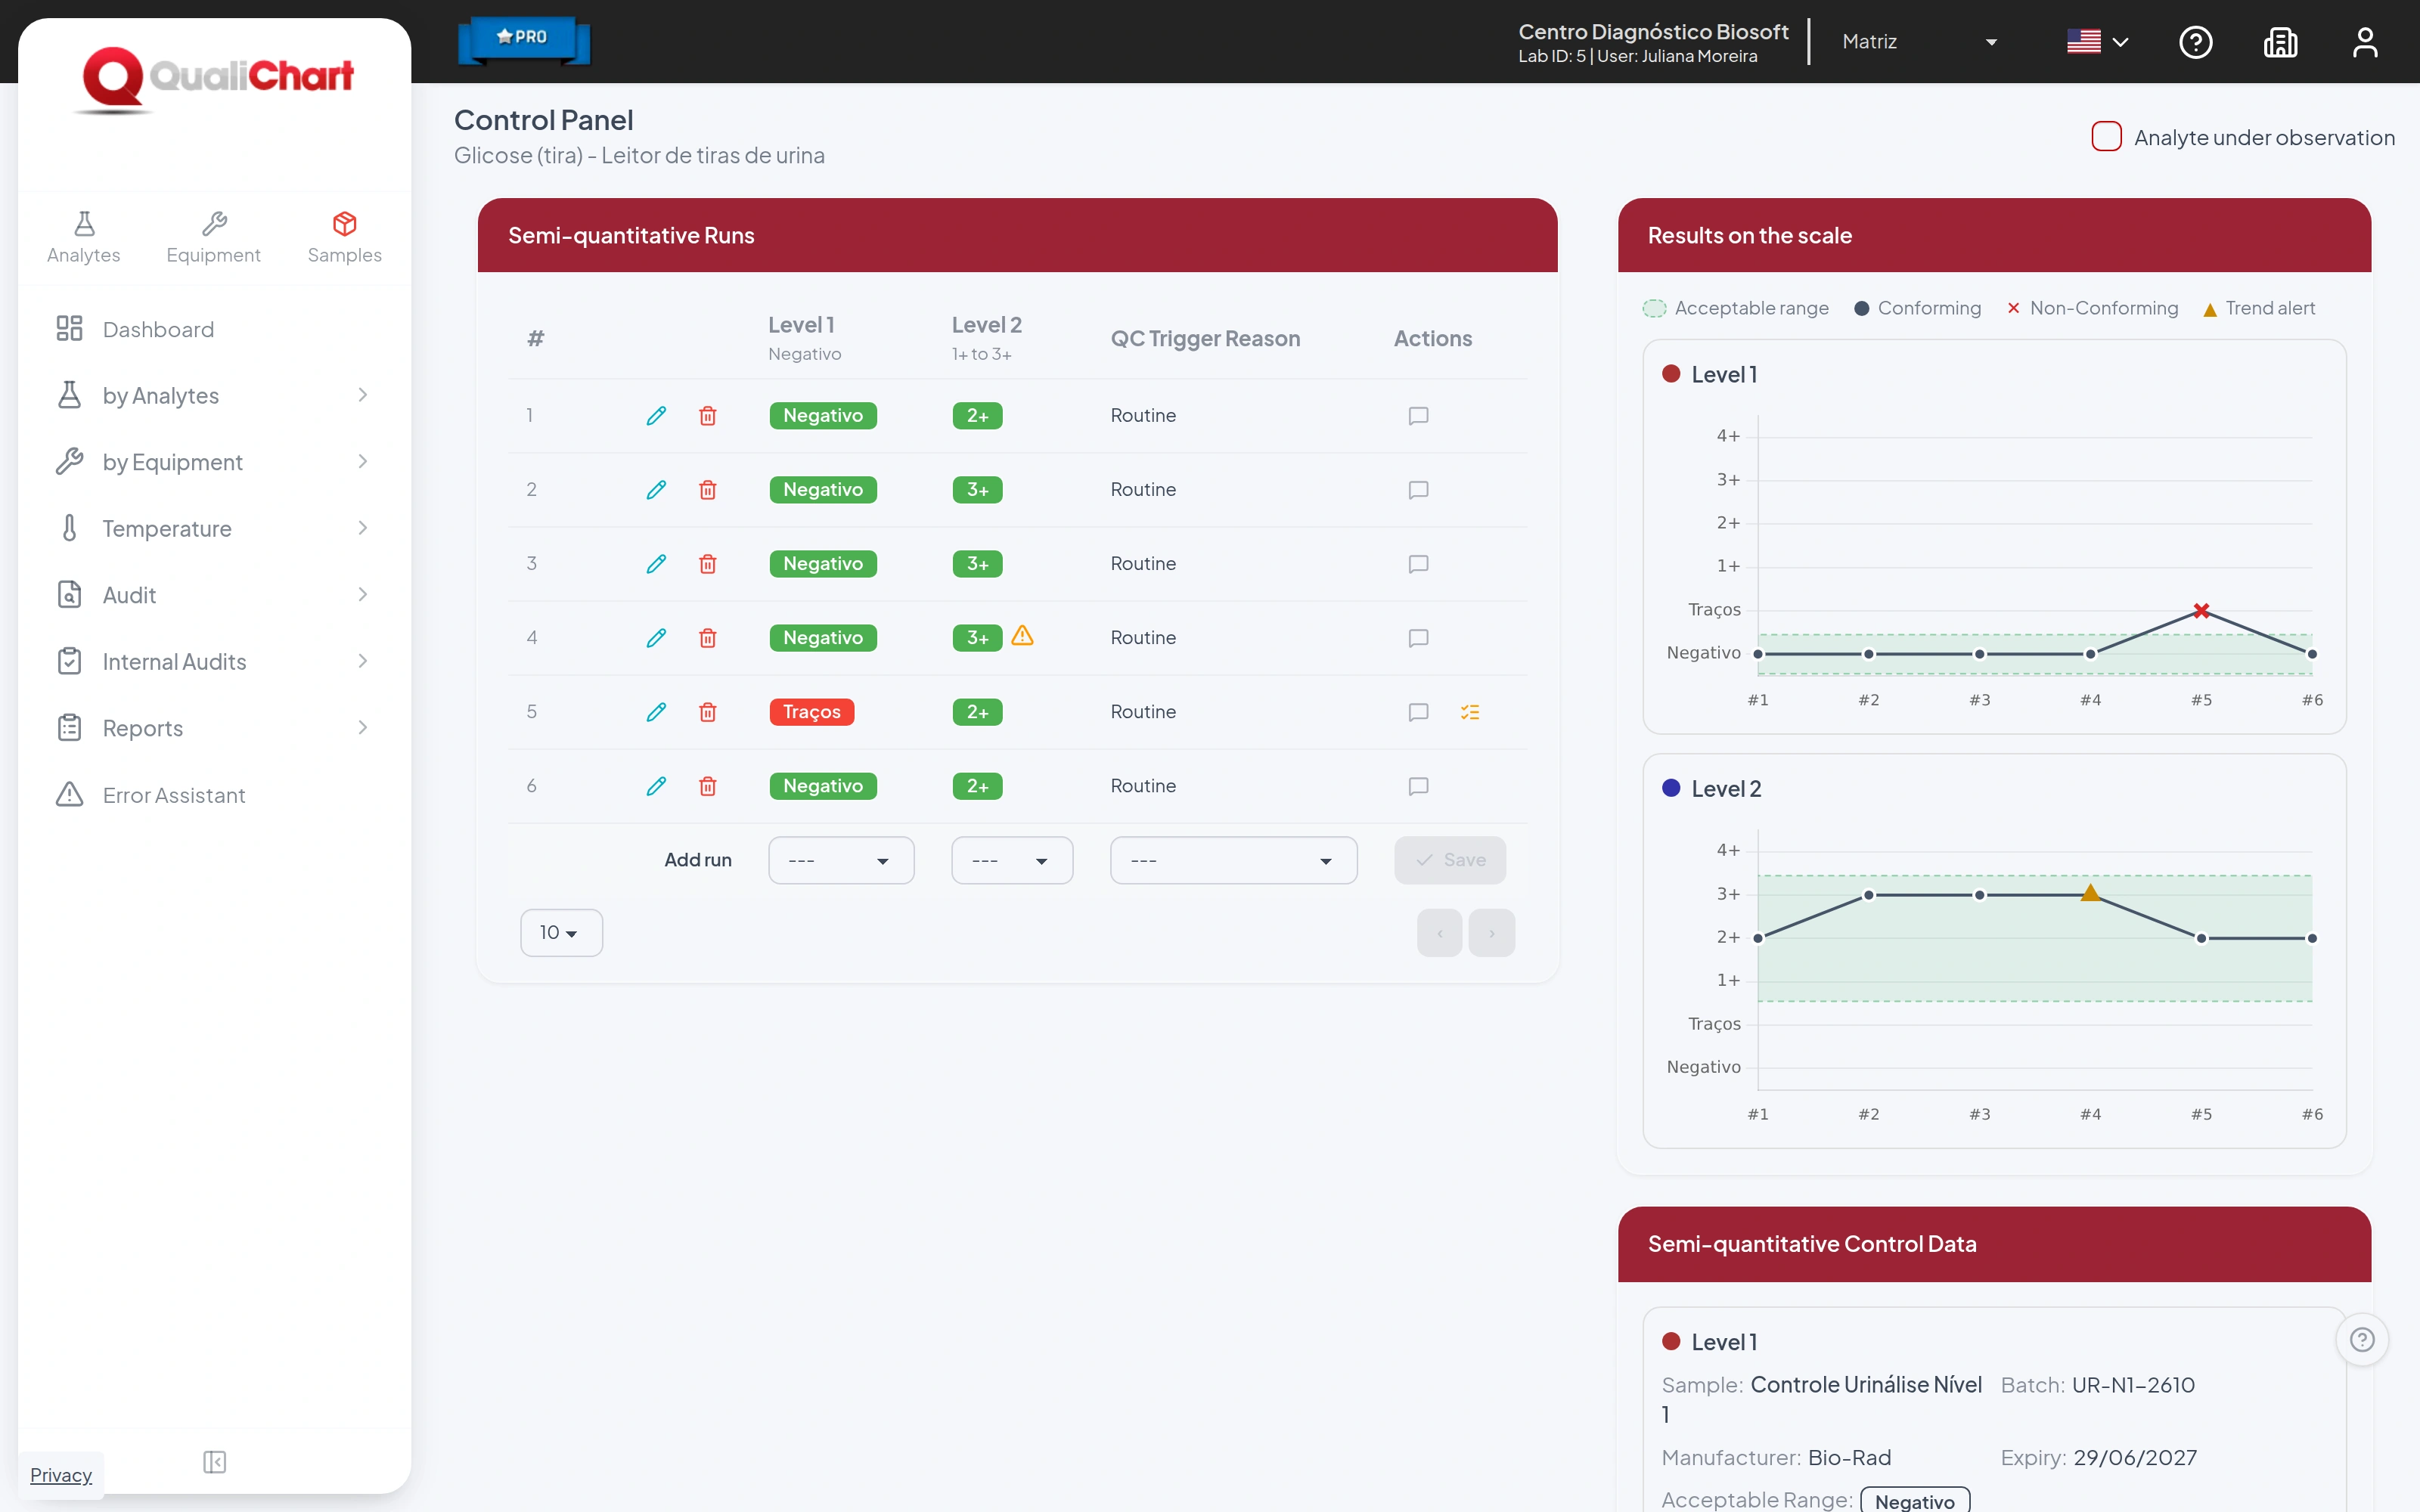
Qualitative analytes are evaluated against the expected result. Semi-quantitative analytes, against an acceptable range on an ordered scale, such as Negative, Trace and 1+ to 4+.
- Conforming or nonconforming at onceEach result is evaluated before it is saved, against the expected result or the material's range.
- Ordered scale per analyteNegative, Trace and 1+ to 4+, pH values or another scale, with the acceptable range for each level.
- Trend alertA warning when consecutive runs fall on the same limit of the range, before a result leaves it.
- Results on the scaleA chart per level with the shaded range and nonconforming results and alerts highlighted.
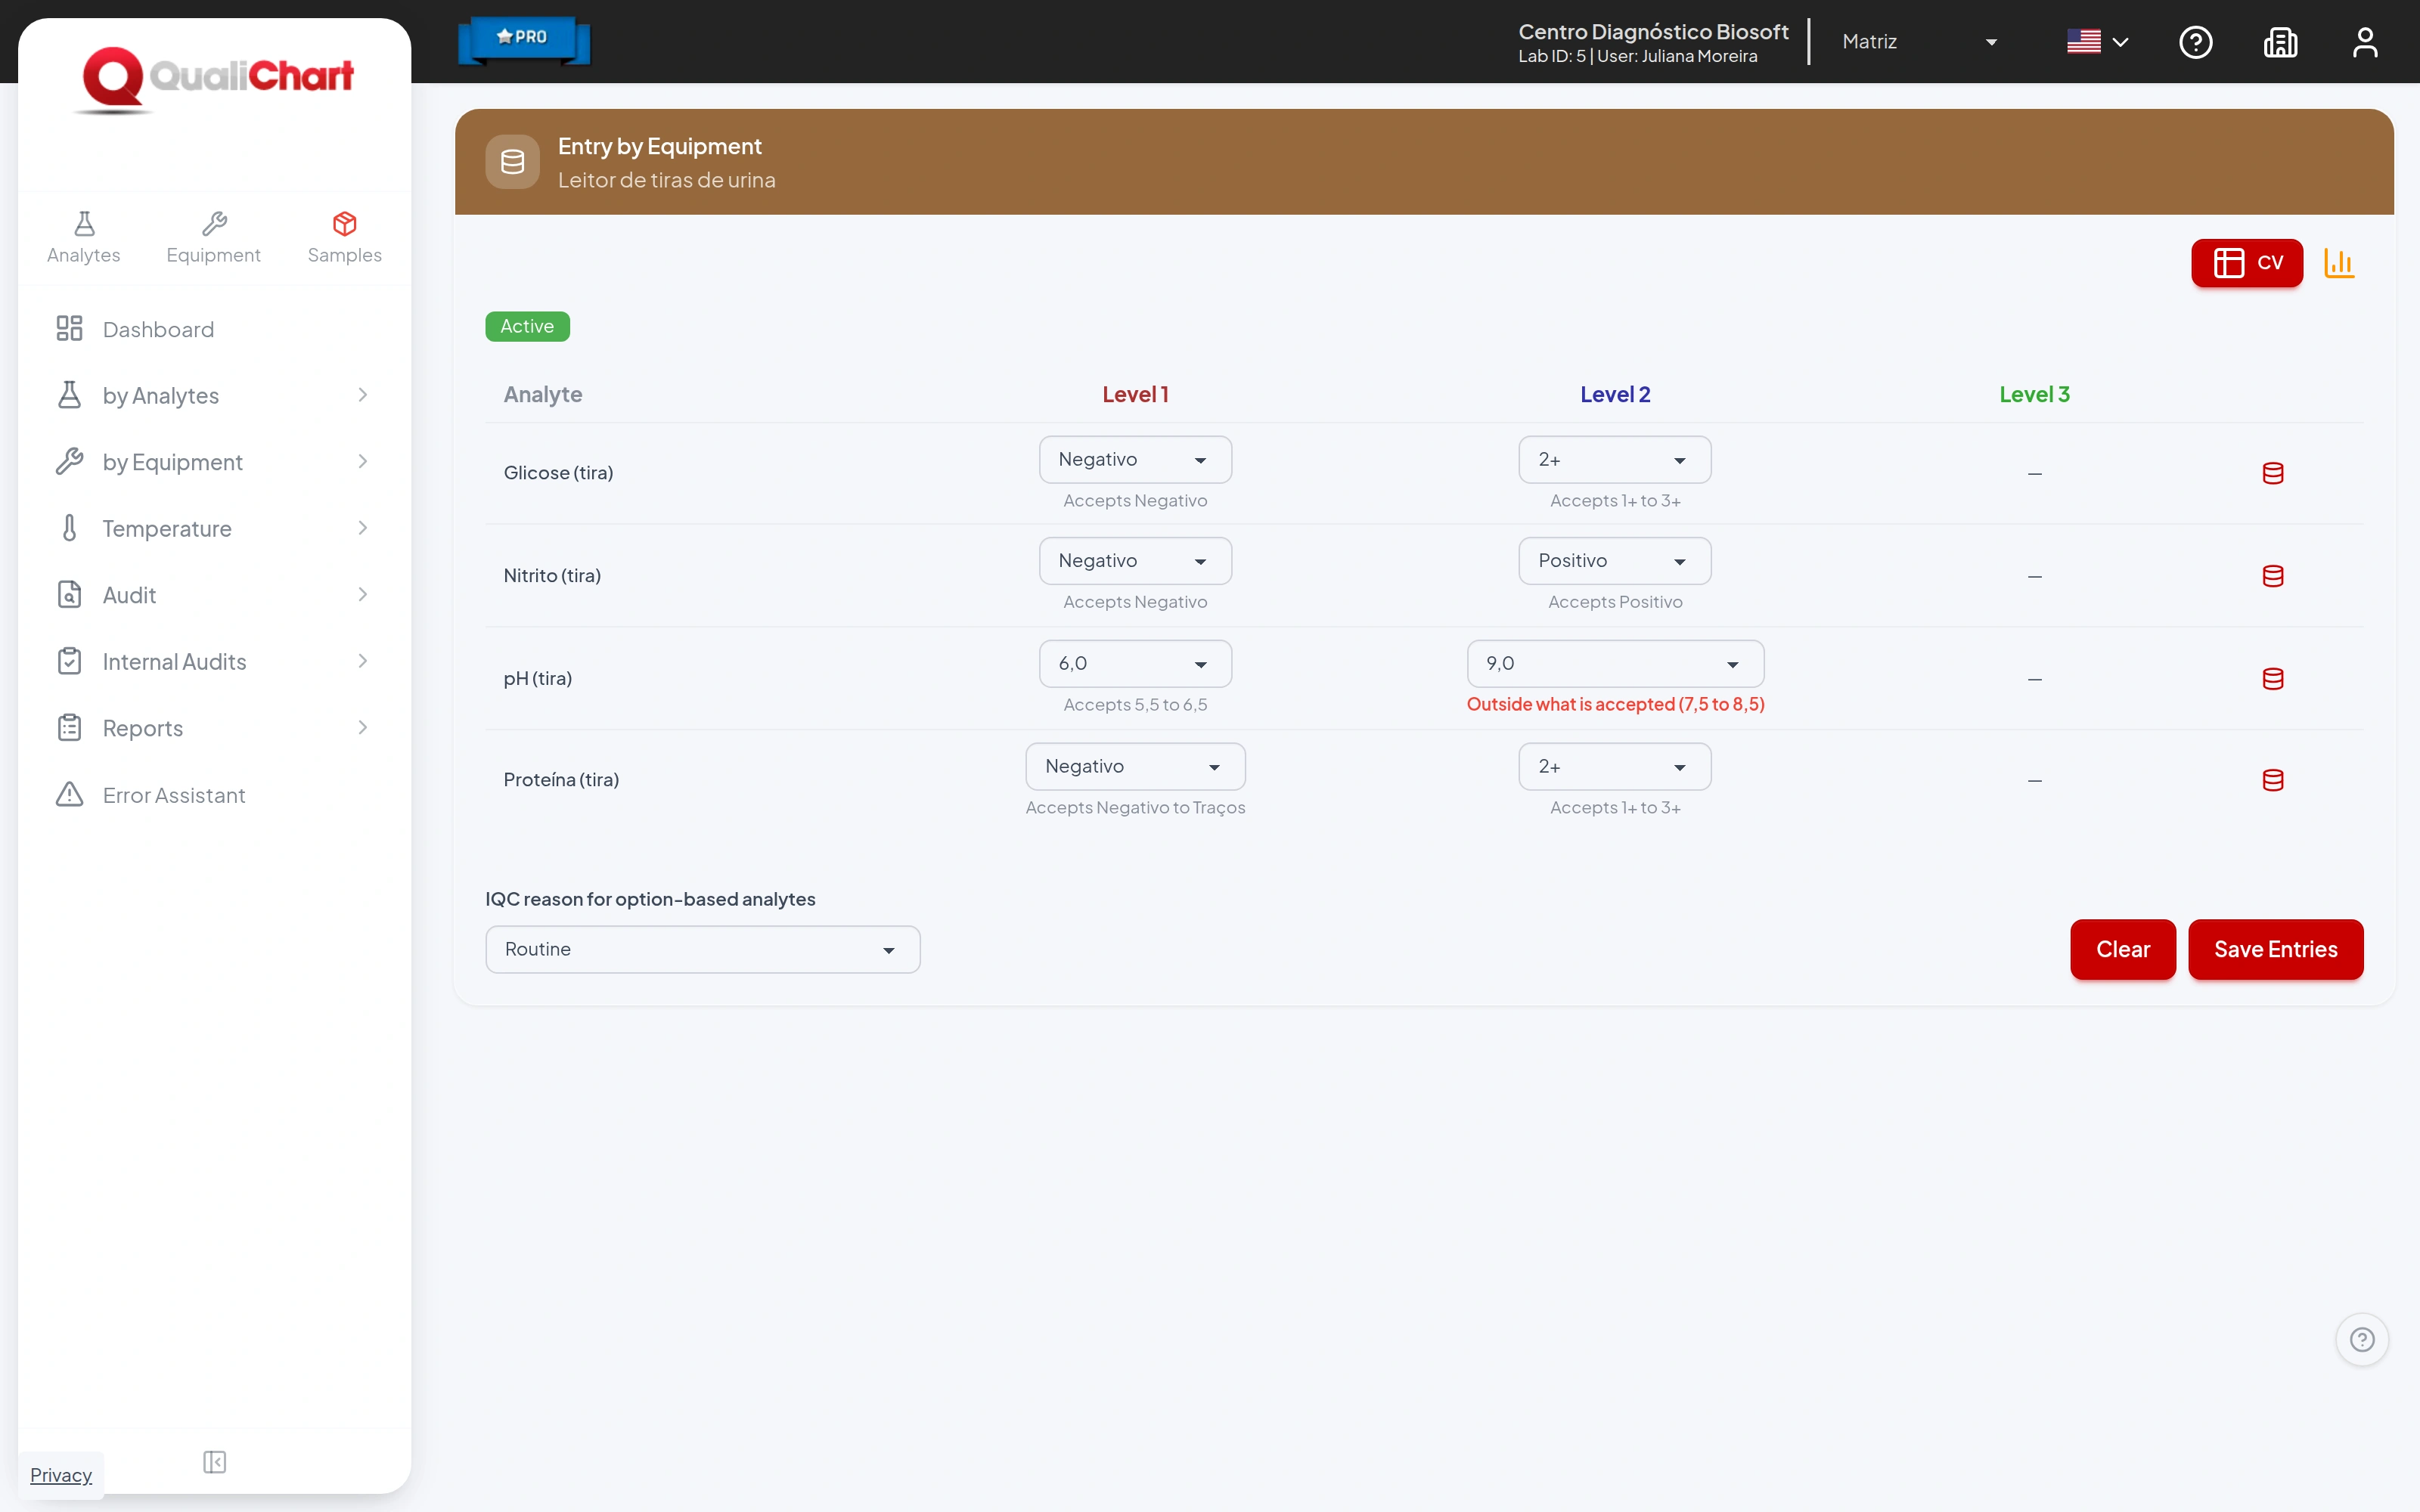
- Entry by stripGlucose, protein, pH and nitrite from the same strip entered together in Entry by Equipment.
- Critical analysis with a written causeRecorded causes become available for the laboratory's next analyses.
Critical supplies
Every lot, from receipt to the runs in which it was used.
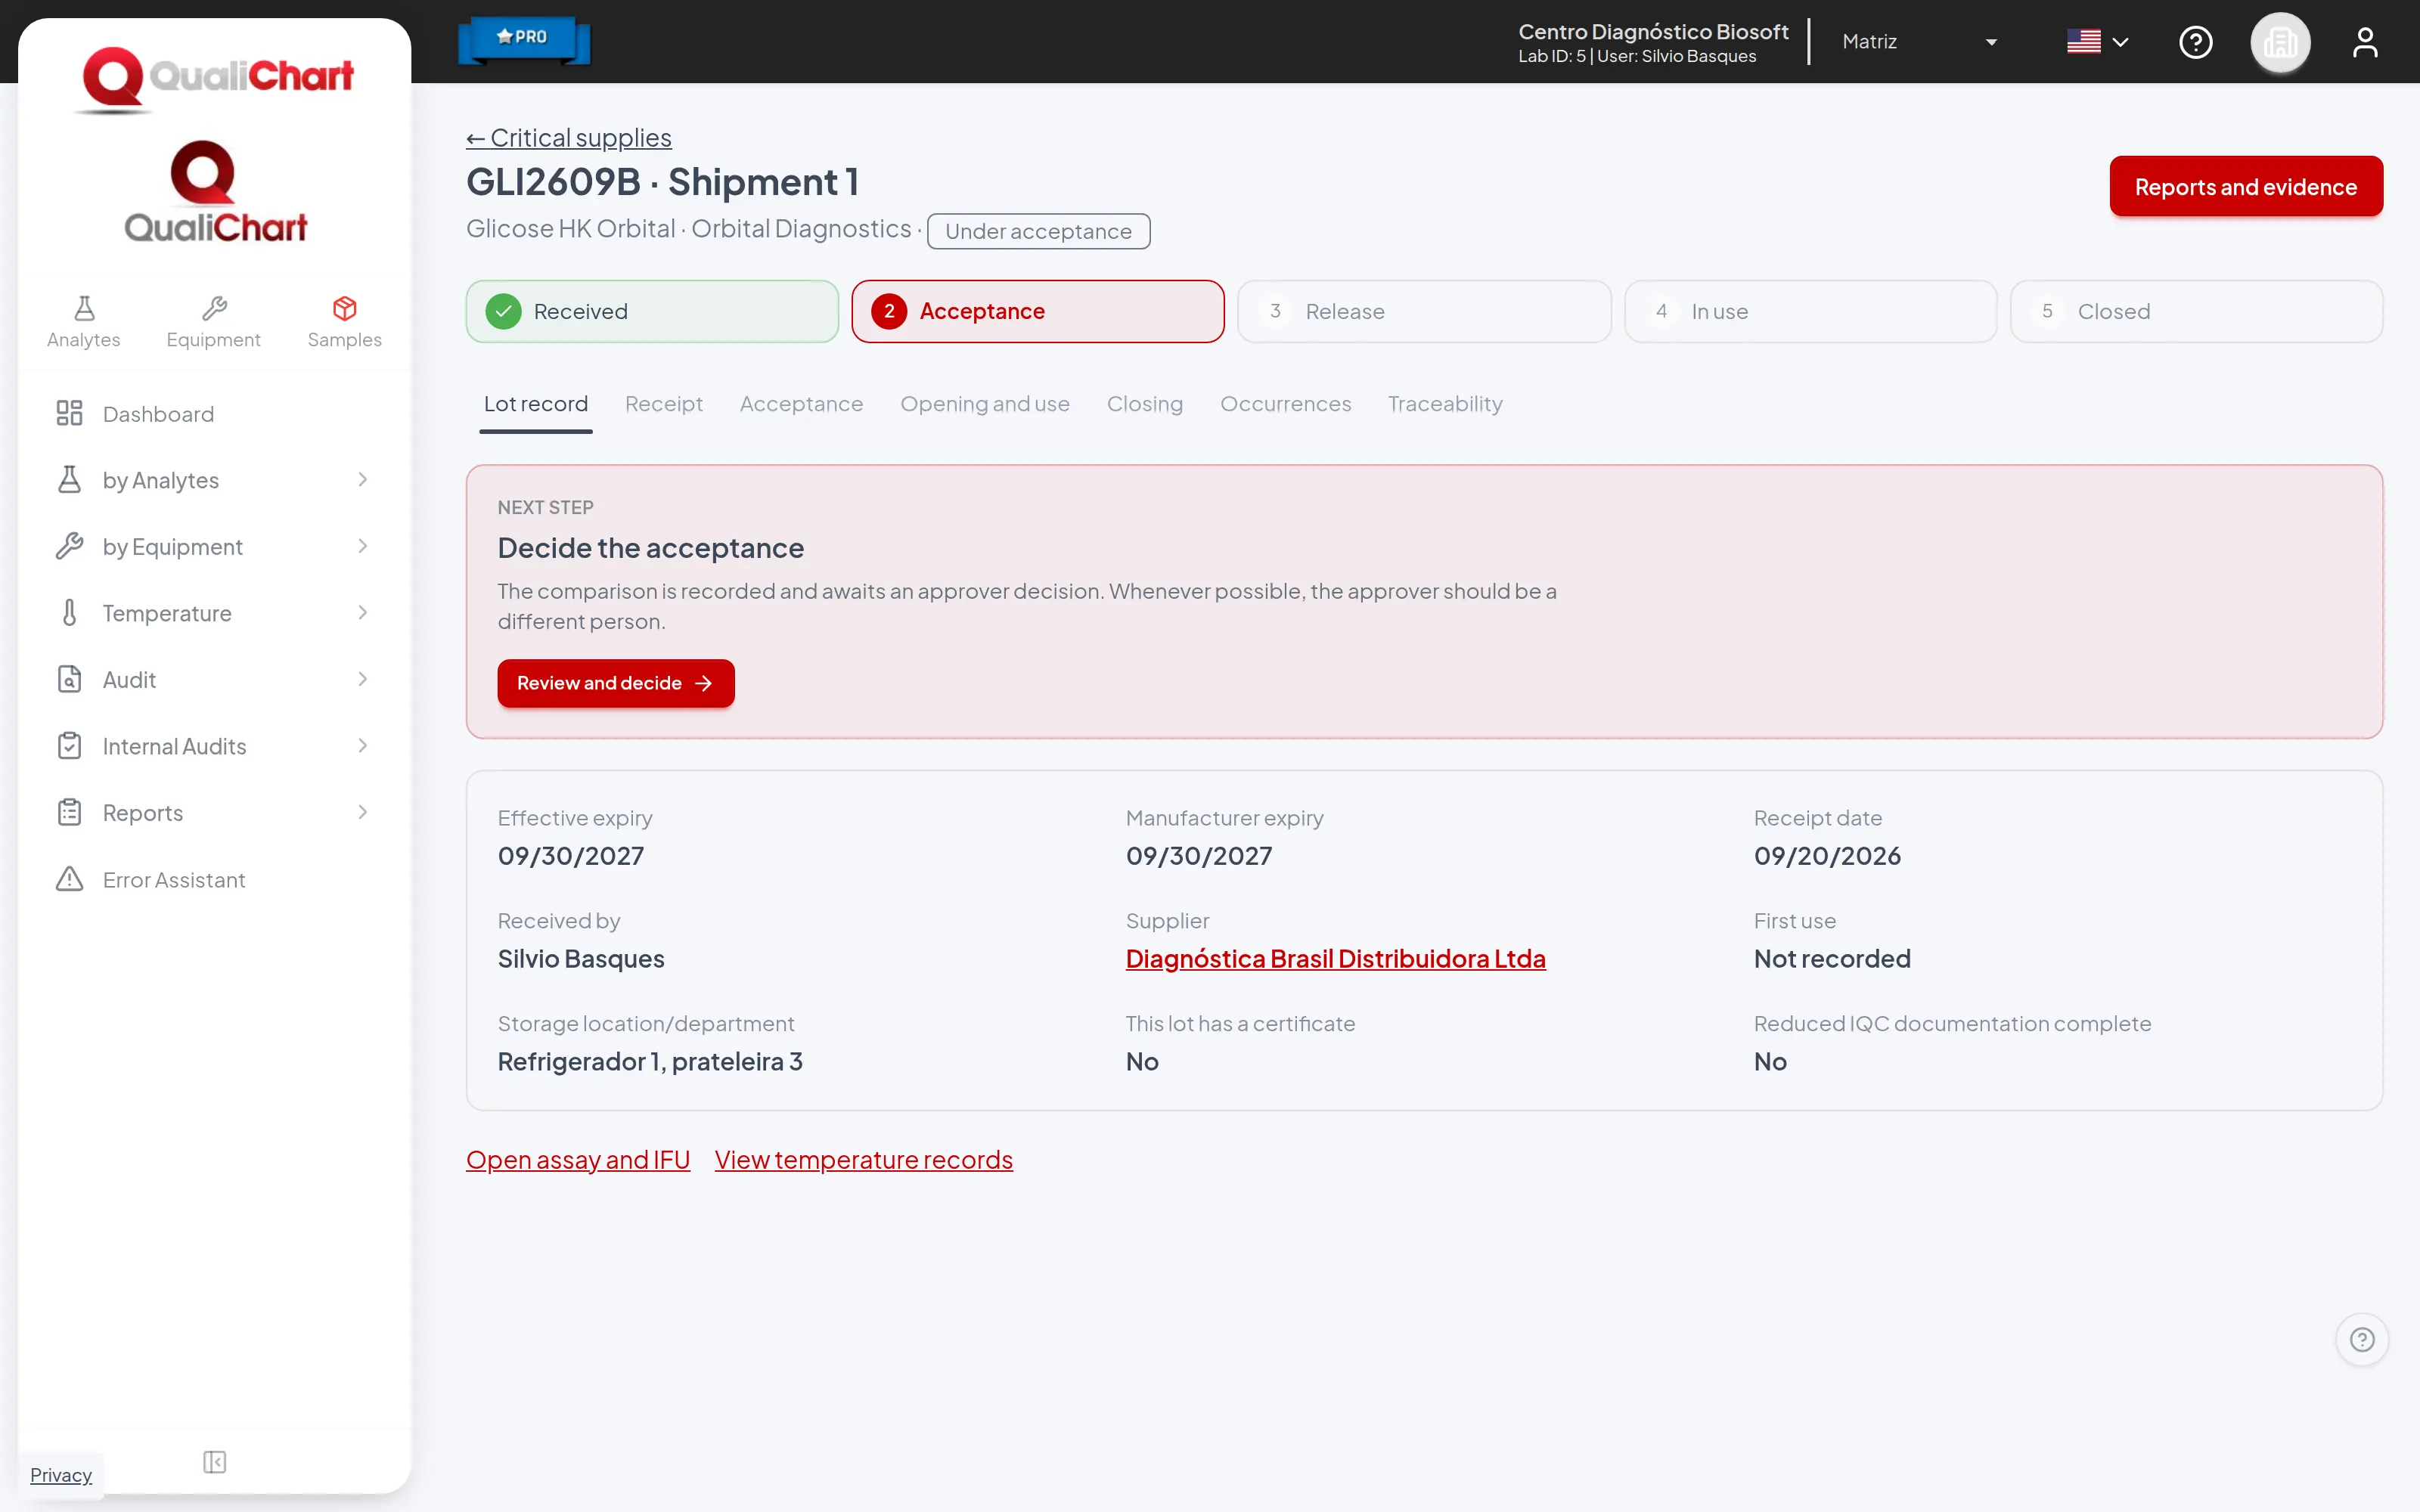
Reagents, calibrators and critical consumables follow their life cycle in the system: approved supplier, receipt, acceptance, use on controls and closure, always with the next step indicated.
Optional: controls without registered supplies keep working as usual.
- Qualified suppliersEvaluation by criterion, approval with an expiry date and periodic reassessment.
- Lot receipt and acceptanceInspection on arrival and lot-to-lot comparison with a criterion defined before measuring.
- Lot recorded on every runOnce its use is declared, the lot is recorded automatically on the control's entries.
- Monitoring on the panelPending items, lots in use, measuring range and the impact of lot changes on IQC.
- Incidents and recallsCritical incidents and recalls block the lot, and the report shows the runs that used it.
- Supply reportsReceipt log, inventory and expiry dates, lot record, traceability and audit trail.
Data entry and import
Results come in the way your routine needs.
Enter results on the control panel, record every analyte of an instrument at once or import the files exported by the instrument or the LIS.
- Entry by EquipmentAll analytes and levels of an instrument on a single screen.
- Validation before savingFor option-based analytes, a value outside what the material accepts is highlighted before saving.
- CSV importResults sent by file, choosing the control phase.
- Custom uploadFiles in layouts specific to the instrument or the LIS.
- Integration assessed with youThe connection depends on the instrument, the LIS and the format they export.
Equipment and temperature
Caution continues outside the analyzer.
Track refrigerators and other equipment with defined limits, measurement history and records of who took each reading.
- Equipment panelErrors in the period, maintenance dates, high-CV percentage and Pareto chart.
- InterventionsMaintenance and calibrations with date, description and attachments.
- Entry auditA 30-day grid to check that every control was run.
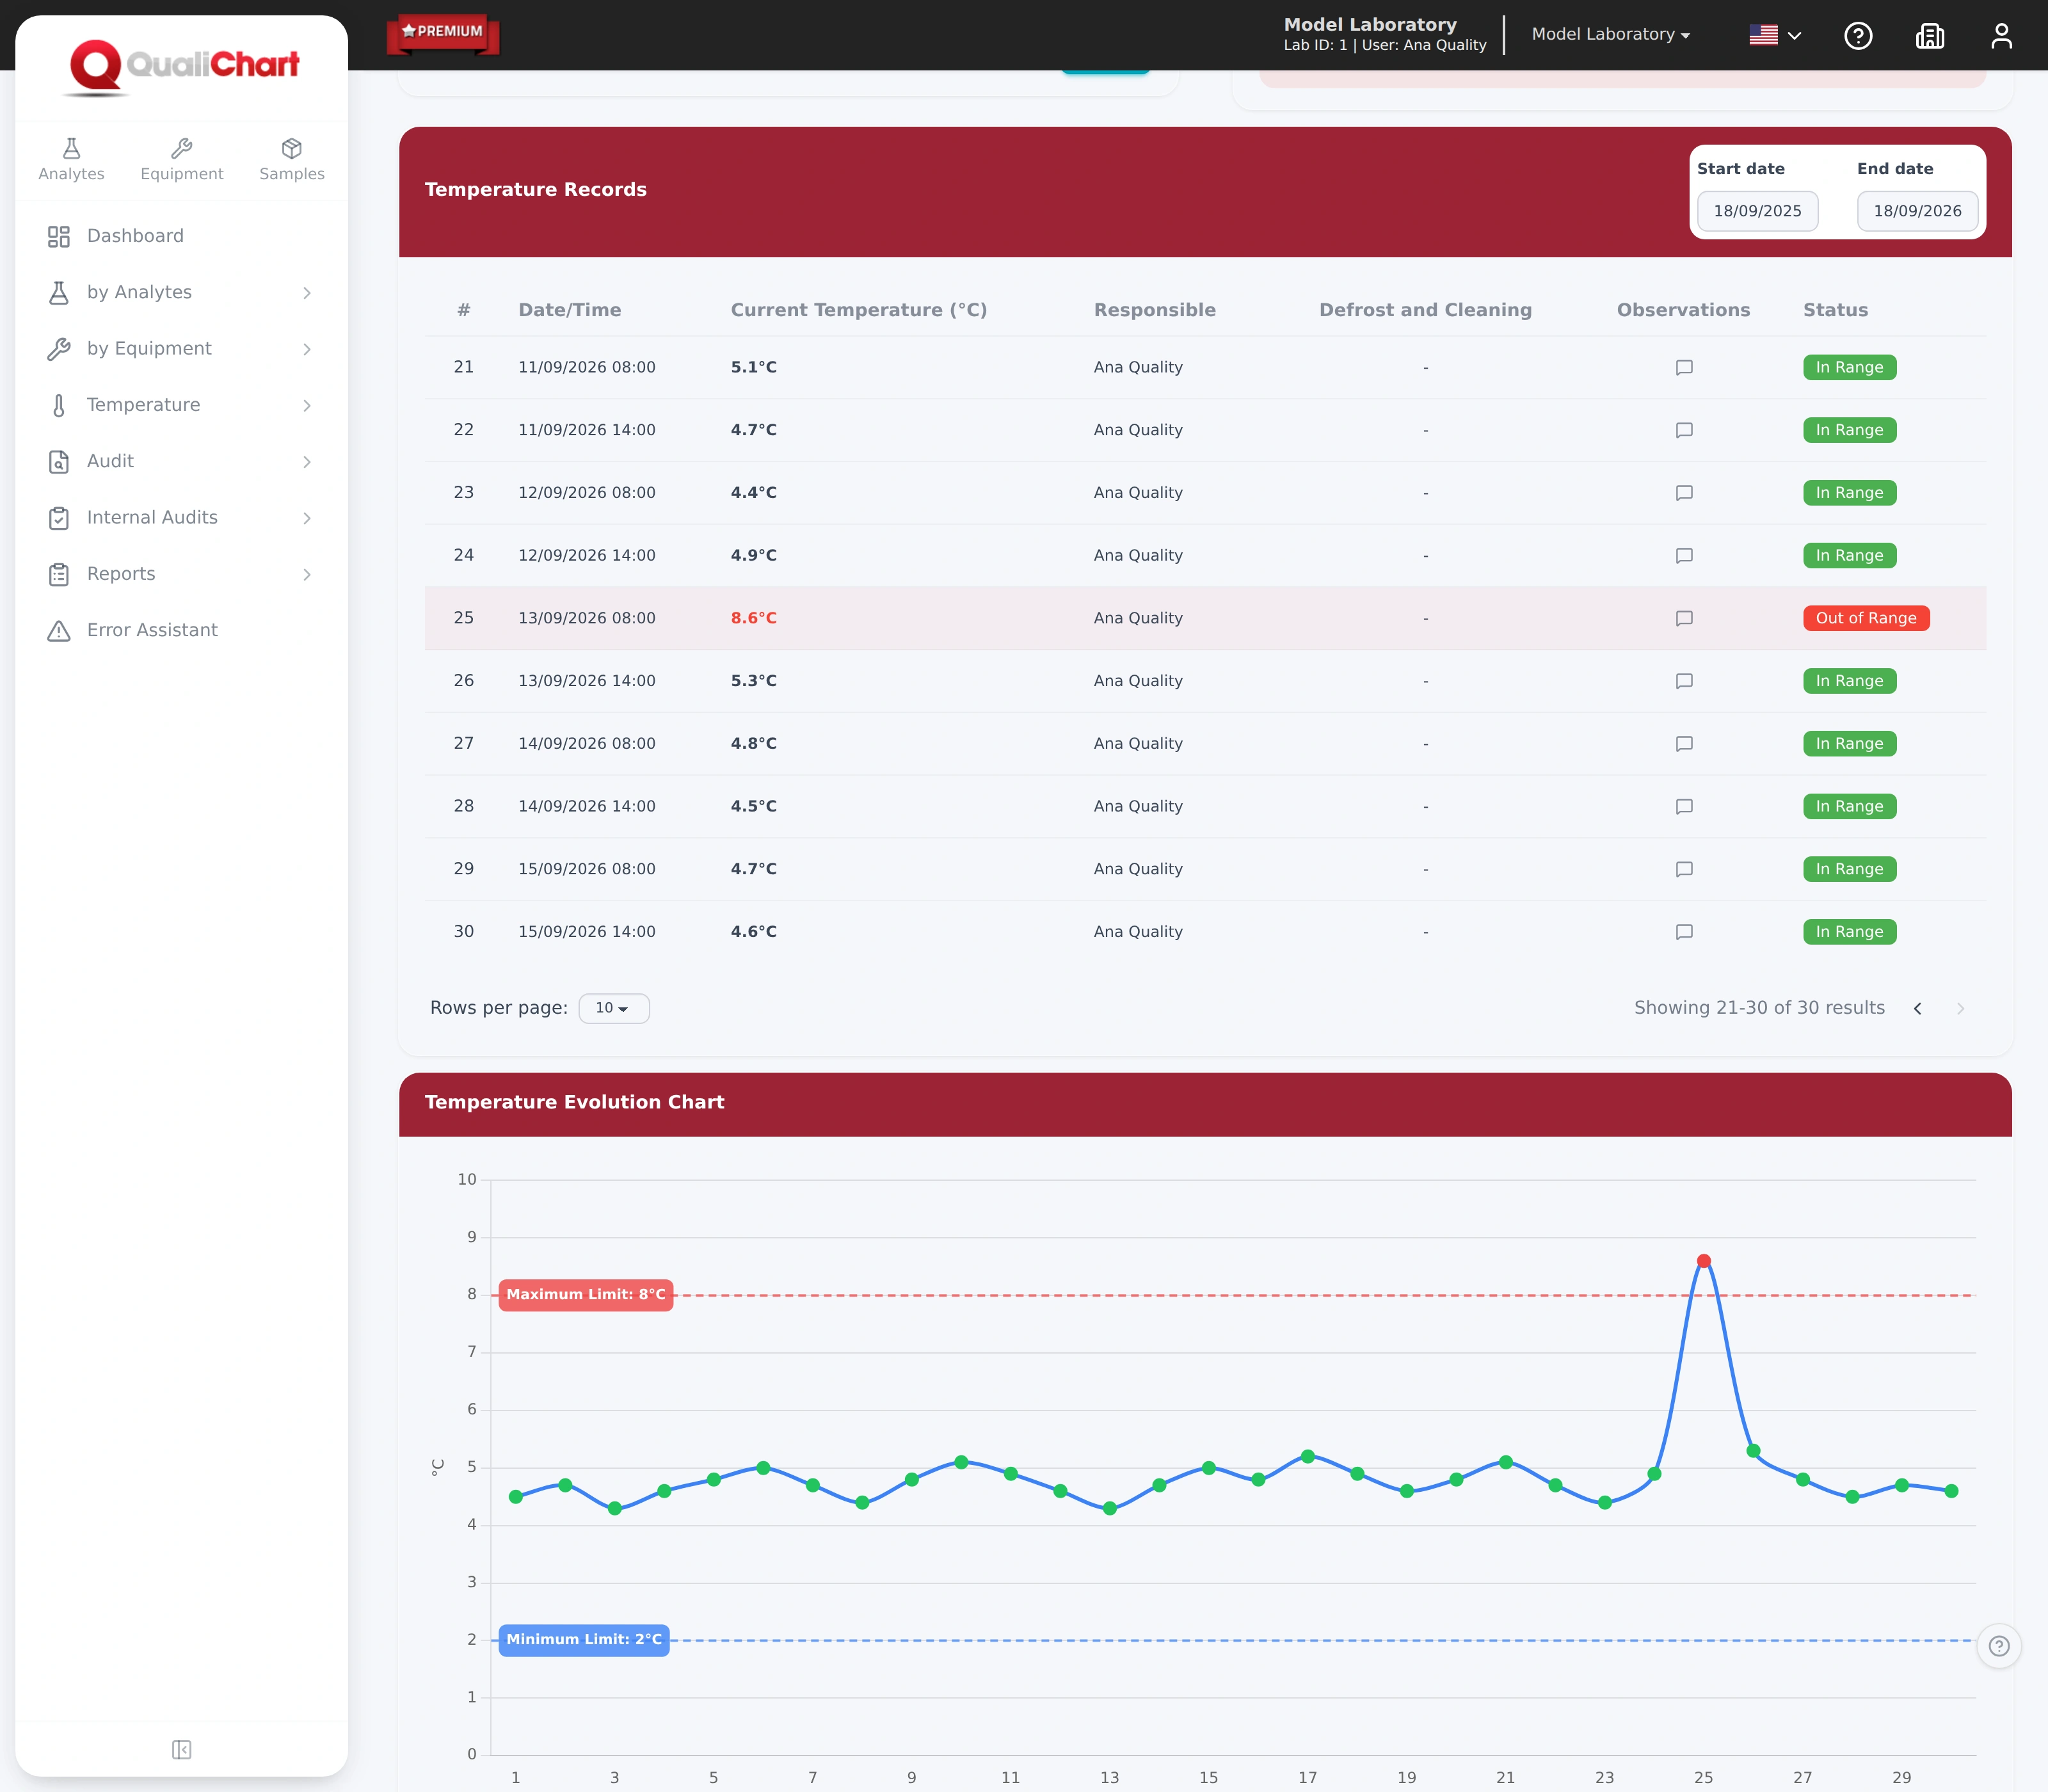
- Temperature with calibrated thermometersRefrigerators, freezers, water baths and incubators, with the thermometer certificate and due date.
- Daily rounds and excursionsOut-of-range readings highlighted, with the event and intervention recorded.
Internal audits
See what's covered. And what needs action.
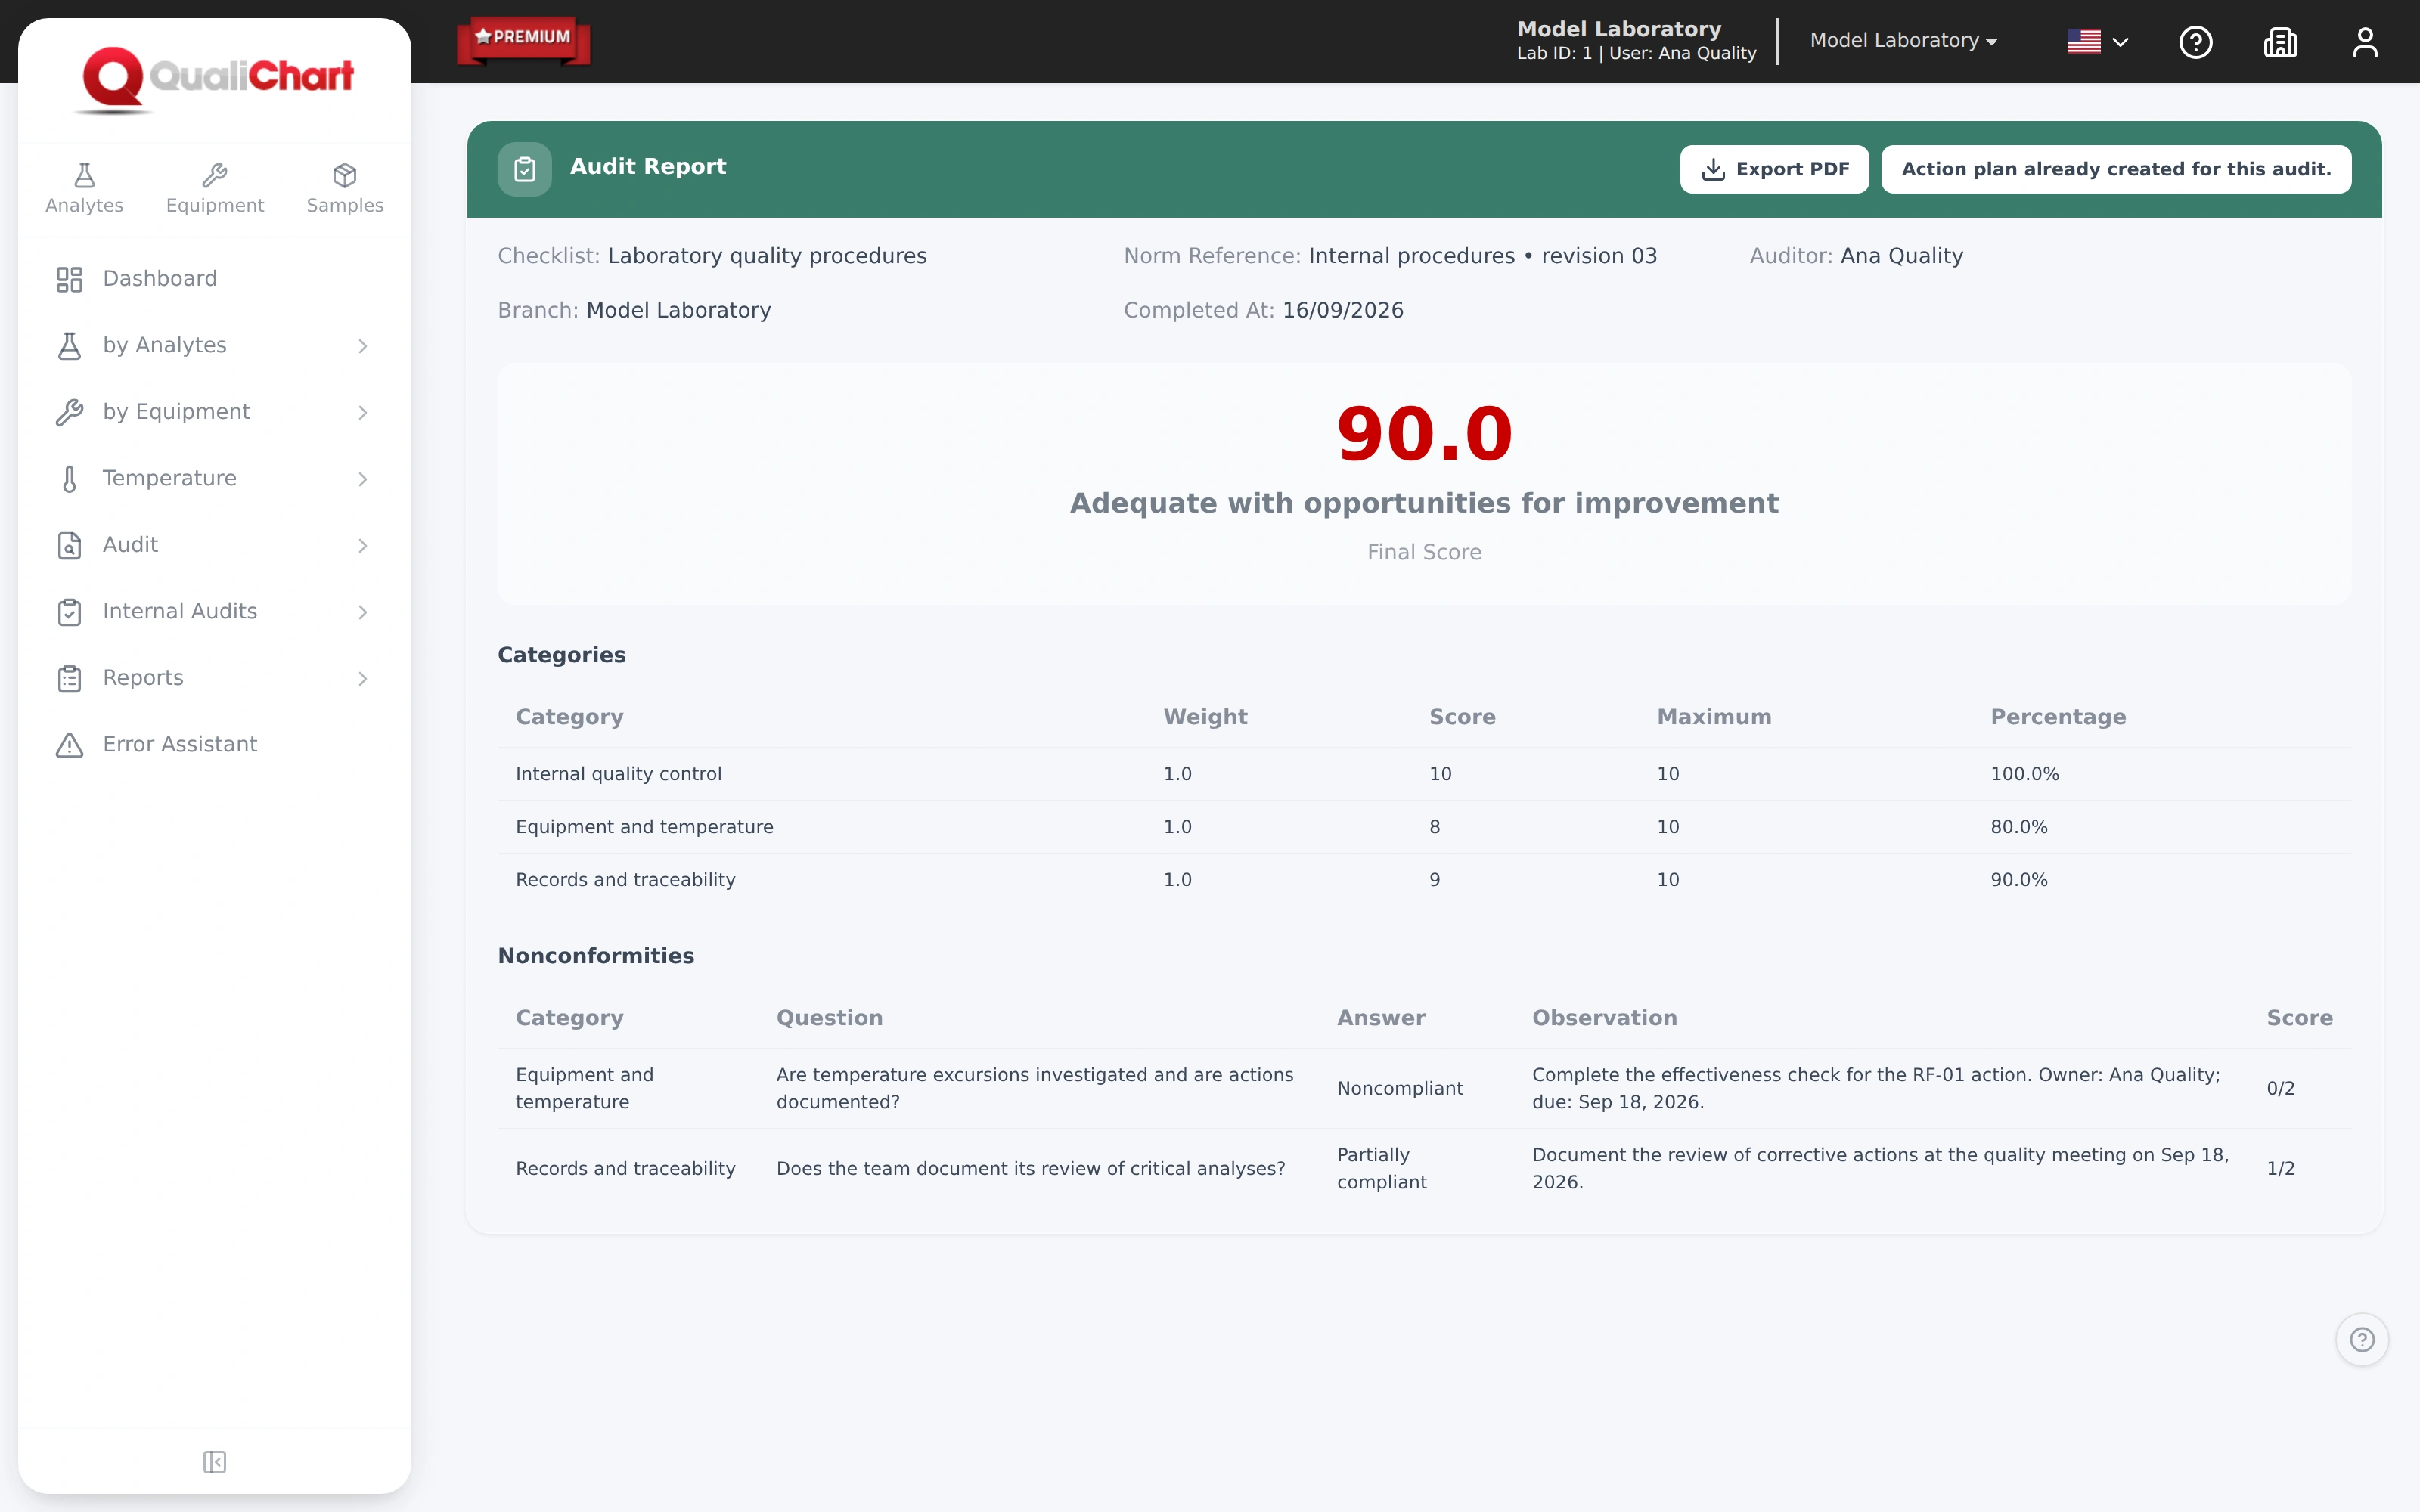
Evaluate the routine with checklists, gather evidence and track nonconformities in a report by category.
- Your own checklistsCategories, questions and weights defined by the laboratory.
- Evidence-based executionAnswers, observations and progress recorded during the audit.
- Results by categoryScore and rating, with nonconformities documented.
- Action planOwner, due date, priority and follow-up for each action, with the report in PDF.
Reports and management
Records ready for audits and inspections.
Reports are issued as PDFs with the laboratory header, in the language chosen in the system. The dashboard and account administration organize the work of the whole team.
- IQC reportsActive controls, preparation review, nonconformities, equipment and analytes, interventions and temperature.
- Several analytical systems at onceA ZIP file with one PDF for each analyte and equipment combination.
- Laboratory dashboardNonconformities, preparation alerts, controls with high CV and analytes under observation.
- Users and access profilesBlock a user without deleting them and keep their action history.
- Multiple branchesEach branch with its own technical manager, address and contact.
- Portuguese, English and SpanishInterface, reports and manual in the chosen language, with help on every screen.
The availability of each feature by plan is confirmed in the proposal. Compare the plans
Your next step in quality control
Put QualiChart to the test. Free for 30 days.
Create your account and evaluate QualiChart in your laboratory. Do you prefer a guided introduction? Request a demo with our team.