
Quantitative IQC
Quantitative internal quality control with Levey-Jennings charts and Westgard rules.
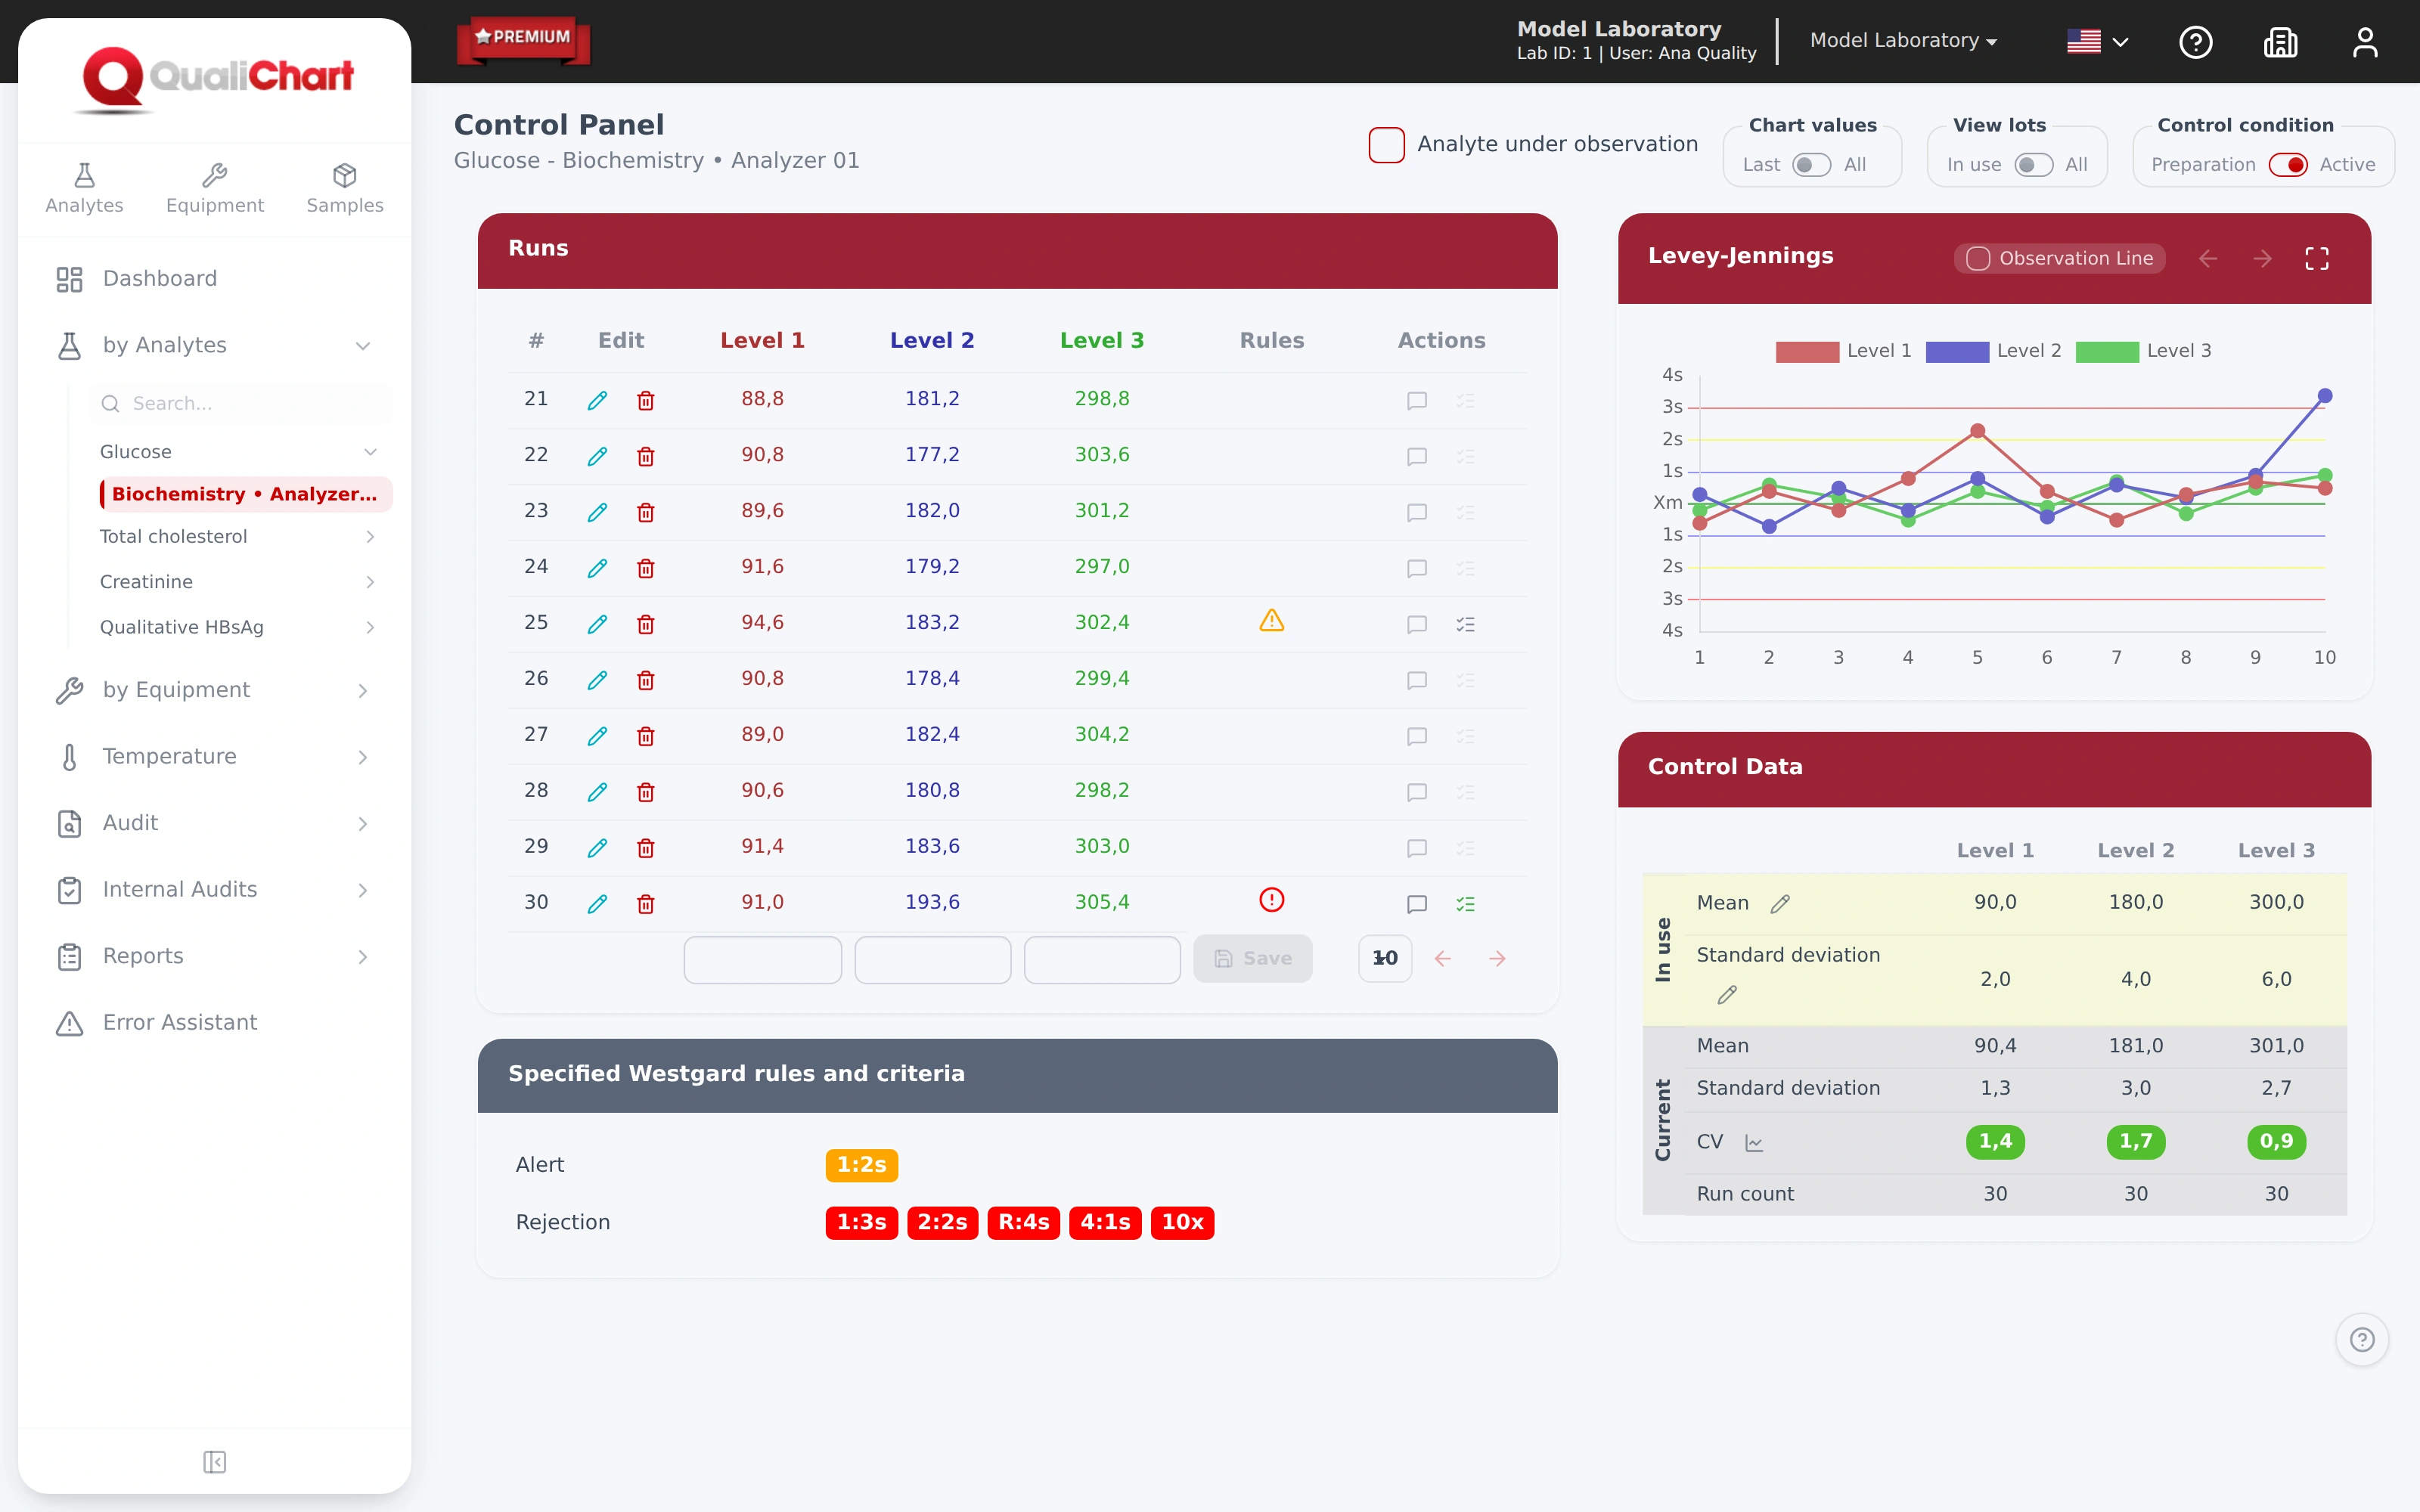
Each run is evaluated as soon as it is saved, with the chart, the mean and SD in use and the investigation recorded on the same control panel.
- Up to three levels per control, in preparation or active
- Action for each Westgard rule defined per analyte
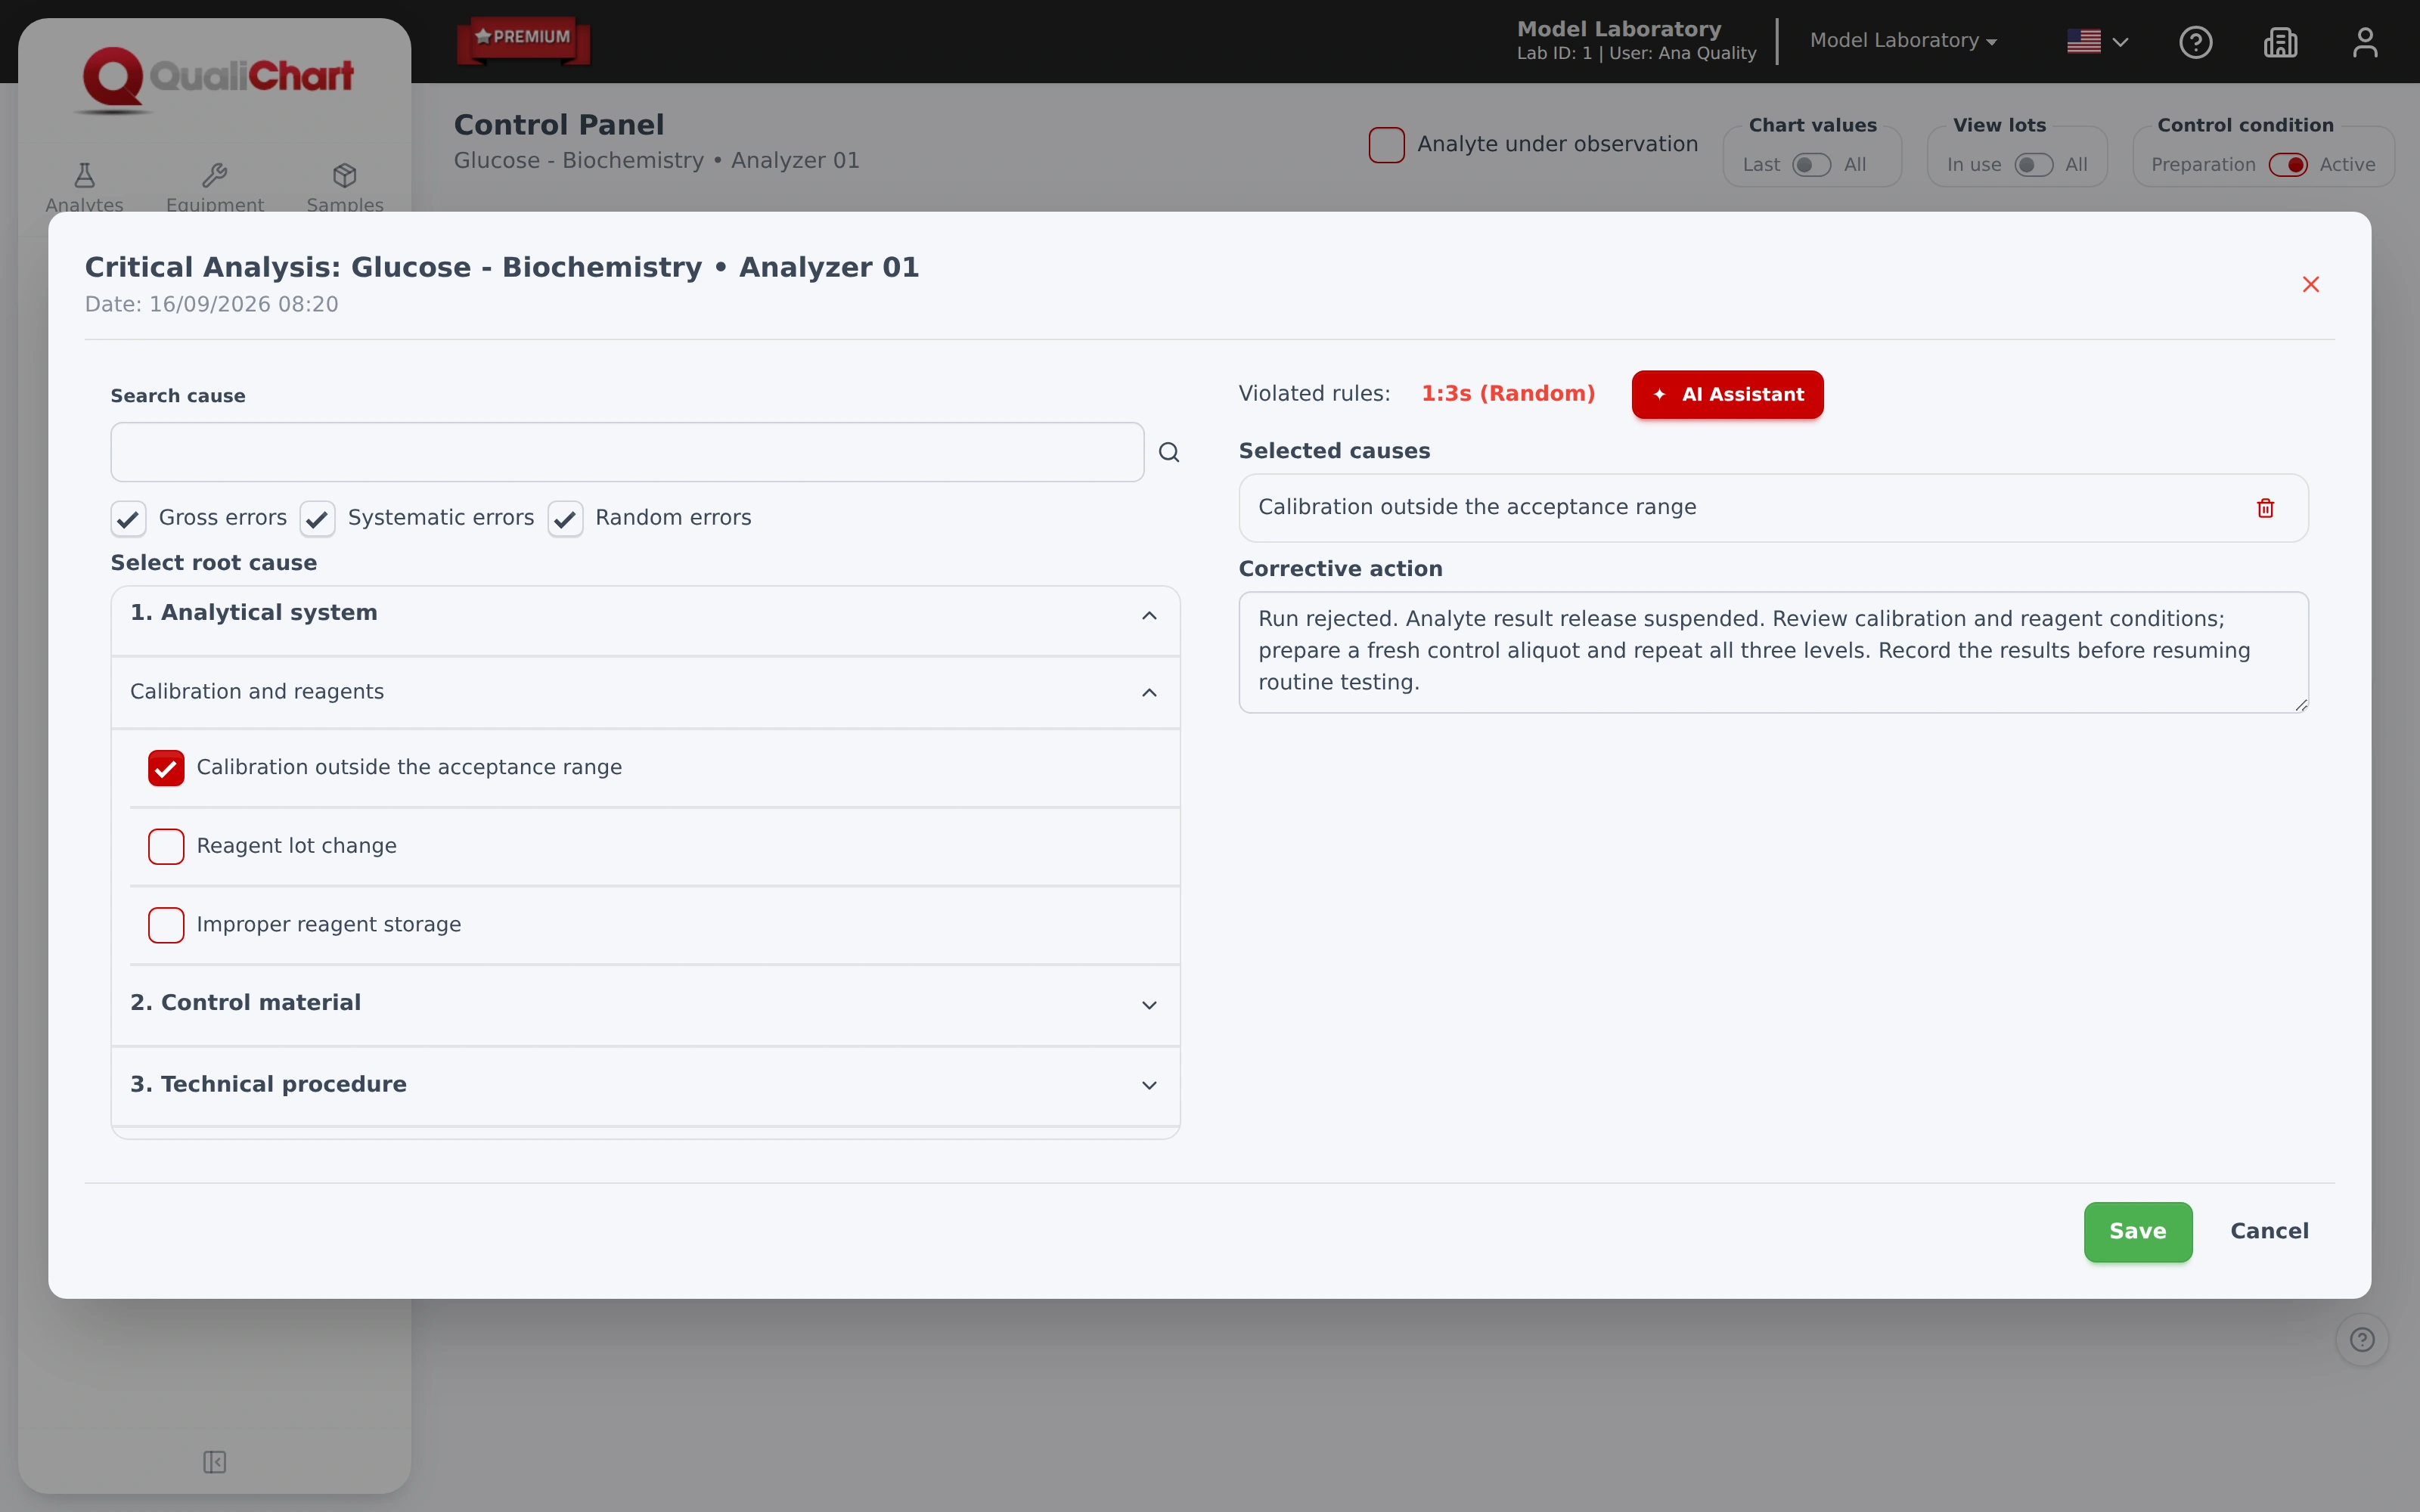
- Critical analysis and corrective action on the run itself
In the laboratory routine
Where quantitative IQC calls for more of the team's attention
Brazil's RDC 978/2025 requires the result of each control sample to be recorded, evaluated against defined criteria and investigated when rejected. In spreadsheets and logbooks, these steps depend on manual checking at every run.
-
The challenge
Rules that span more than one run
Violations such as 2:2s, R4s and 10x depend on previous results and sometimes on more than one level. Checking them by hand at every run takes time and may vary from one person to another.
In QualiChart
Each value is evaluated against the configured rules as soon as it is saved. Warnings and rejections appear in the rules column and on the Levey-Jennings chart.
-
The challenge
The laboratory's own mean and SD
Package insert values are usually wider than the actual dispersion of the system. Establishing the laboratory's own parameters requires a collection period and a documented review.
In QualiChart
Every new control starts in preparation. After 20 runs per level, the team reviews the calculated mean and SD and activates each level.
-
The challenge
Investigation kept away from the result
When the cause and the action are recorded in another document, reconstructing the decision taken on a rejected run means looking for records in different places.
In QualiChart
The critical analysis stays on the run itself, with the causes from the Error Wizard, the corrective action and the name of the person who recorded it.
How it works
From setup to the decision on the run
Register the analyte, equipment and material
The analyte receives its unit, maximum imprecision, TEa and the action of each rule. The material records lot, expiry date, level and the insert mean and SD.
Establish the mean and SD
During preparation, violations appear as warnings. After 20 runs per level, review the calculated parameters and activate the level.
Enter and evaluate each run
From the control panel, the entry by equipment or a file. The rules evaluate the saved value, and the chart and statistics are updated.
Record critical analysis
On a run with a warning or rejection, select the causes, describe the corrective action and, if you wish, consult the AI assistant.
Capabilities
From data entry to decision, on a single screen.
The control panel brings together the control runs, the Levey-Jennings chart and the control data for each level. Westgard rules evaluate every result as soon as it is saved.
- Levey-Jennings PlotUp to three levels per control, with the mean and SD in use and those calculated from the series.
- Westgard rules by analyteChoose whether each rule warns, rejects or is disregarded.
- Preparation and activationEach control starts in preparation and is activated after 20 runs per level, with a review of the mean and SD.
- Review and investigationCause and corrective action recorded on the rejected run, using the Error Assistant catalog.
- AI AssistantPossible causes and next steps to support the investigation. The decision rests with your team.
- Analytes under observationFlag the controls that need follow-up and find them on the dashboard.
Requirements and good practice
What regulations require of internal quality control
- RDC 978/2025 · Art. 180
IQC must cover the recording and analysis of the control sample result, acceptance and rejection criteria, the release or rejection of analyses and the recording of inadequacies, the causes investigated and the actions taken.
Read the source - RDC 978/2025 · Art. 176
The documentation of quality control management includes the limits and acceptability criteria and the evaluation and recording of control results.
Read the source - RDC 978/2025 · Arts. 115 and 116
Records must be kept for at least five years, and changes must include the date and the person responsible, preserving the original data.
Read the source - ISO 15189:2022 · 7.3.7.2
The laboratory shall have an IQC procedure that monitors the ongoing validity of examination results against specified criteria and verifies that the intended quality is attained.
Read the source
QualiChart organizes the recording, evaluation and traceability of IQC. The choice of rules, materials and frequency remains a technical decision of the laboratory, under the evaluation of its technical manager.
Which Westgard rules does QualiChart evaluate?
1:2s, 1:3s, 2:2s, R4s, 4:1s, 7x, 10x and 7T. For each analyte, the laboratory defines whether each rule warns, rejects or is disregarded.
Does the system decide whether patient results are released?
No. QualiChart applies the configured rules and flags warnings and rejections. The decision to release or reject the analyses belongs to the team, which records it in the critical analysis.
How many levels can I control?
Up to three levels per control, each with its own material, lot, mean and SD. Activation is done per level, after the parameters from the preparation period are reviewed.
Does the AI assistant determine the cause of the error?
No. It suggests hypotheses and next steps using the context of the run. The team records only the conclusions supported by the investigation.
Further reading
Related content
Your next step in quality control
Put QualiChart to the test. Free for 30 days.
Create your account and evaluate QualiChart in your laboratory. Do you prefer a guided introduction? Request a demo with our team.