About the author

Silvio de Almeida Basques
Author of materials on internal quality control and information systems for laboratories.
Training and experience
Doctor, with residency and postgraduate degree from the Federal University of Minas Gerais and specialist title from the Brazilian Society of Clinical Pathology. Retired professor at the UFMG Faculty of Medicine.
Introduction
To be confident that the results of patient tests are as close to reality as possible, it is necessary to believe in the adequate performance of the analytical system.
Most laboratory test results are expressed in numbers. To be confident that the results of patient tests are as close to reality as possible, it is necessary to believe in the adequate performance of the analytical system, thinking about quality in quantitative terms.
The most cost-effective method for this is to analyze a reference material, known as control material, and treat the results obtained using a statistical method and model. The main objective of this control is to demonstrate that the analyzing system is stable and that it provides results that reflect reality — that is, they are of good quality. It means thinking and practicing quality in quantitative terms, applying calculations and analyzes based on rules that are based on statistical probabilities.
Being able to rely on statistics to assess the stability of the analytical system is an advantage available to laboratory professionals. For this purpose, Statistical Control of Analysis Processes is used, applying the Control Chart, originally proposed by Shewhart. In 1981, Dr. J. O. Westgard et al.1 described a set of rules applicable to the Shewhart (Levey-Jennings) graph, establishing uniform decision criteria to judge the quality of the result of the control run.
One of its objectives was to standardize the interpretation of results, to maintain a consistent level of quality.2 The rules follow statistical principles of probability and, when violated, should point to the type of error that would have occurred. They are called Multiple Quality Control Rules, or Westgard Rules.
They help to interpret the results obtained on the bench, analyzing data from different levels in an integrated manner, inter-assay and intra-assay. Its use helps everyone to recognize the situation, greatly reducing the natural complexity of this internal control operation.
Multiple rules provide greater sensitivity of the Internal Quality Control System (IQC) in detecting problems. They translate statistical probability and when violated, the problem must be analyzed.

The multiple rules for Internal Quality Control are widely used in Brazil, but they are also the subject of controversy.3 We understand that they are very practical, didactic and useful to assist laboratory professionals in monitoring their control systems.
We must take into account that the assessment of the control state in the clinical laboratory using multiple rules only applies to quantitative analyses, since it is a statistical method, which requires numerical data.
There are several rules that can be used alone or together and it is up to the professional to choose the standard that best represents their determination to control the imprecision of the analytical system in question. Ideally, the quality manager should specify a set of rules that best helps identify problems, obtaining a higher error detection rate. Rules are often used for systems with two levels of control (N = 2), but also with three and four levels. Some of them can be applied to only one level of control.
In computerized IQC systems, several rules are tested and the indication of violation of a rule constitutes an important contribution for the experienced IQC professional and for those just starting out, because it points to an outlier run — that is, with a result that is outside of what was statistically expected in a series of data. However, there must always be the professional's judgment about which set of rules best applies to different analytical systems.
Notation
Multiple rules are represented in a special way. The way most used and described by Westgard is by indicating the number of times a situation occurs and the limit on the control chart. In drawings and figures it is practical to represent with fonts of different sizes, but in text and on computers we prefer to adopt another notation — with the ':' separator, thus leaving 1:2s.

The letter s comes from the English standard, which makes up the term "standard deviation" — that is, standard deviation in Portuguese.
The first digit represents the number of control results that exceed the specified tolerance limit. In the 1:2s example, this is the occurrence of a result that was plus or minus two standard deviations in relation to the reference average.
The second digit means that the tolerance limit established for the control was 2SD, above or below the average. There will be a violation of this rule when the result exceeds this limit.
The rules help us understand nonconformity and also provide information about the type of error, whether systematic or random. From this classification we can go over a list of possibilities to find the root cause of the problem.
Multiple Rules Description
Control procedures must be able to detect measurement errors adequately, with a lower rate of false rejection. As analytical systems have their own characteristics, a rule model must be adopted that is most appropriate for each system that you wish to control.
Knowledge of systems behavior is an important factor in specifying control strategies. Proper use of control rules improves the error detection rate, with a lower false rejection rate.
Below we describe the most used multiple rules, representing the situation indicated by each rule on the Levey-Jennings graph.
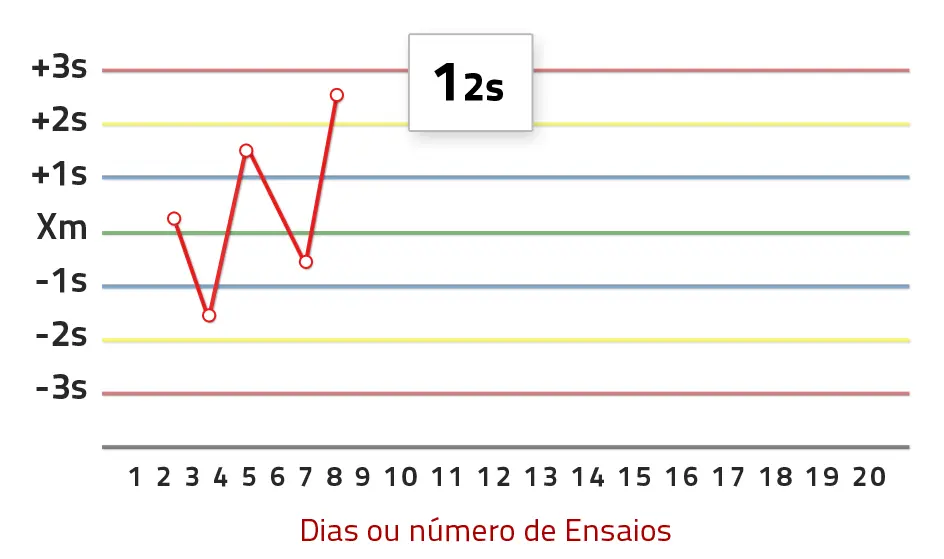
Represents the control rule where the value of one of the controls exceeds the limit of Xm ± 2s. Does not imply rejection.
The occurrence of 1:2s is the control map warning sign and indicates that additional inspections must be carried out on all data.
In a manual system, the following rules apply to decide whether results can be accepted or should be rejected. In an automated system, all rules are tested, because there are situations in which there is no violation of 1:2s and another rule indicates a systematic error. As an example, see the 4:1s rule, or the 7T.
Its use as a rejection is not recommended, only as a warning.
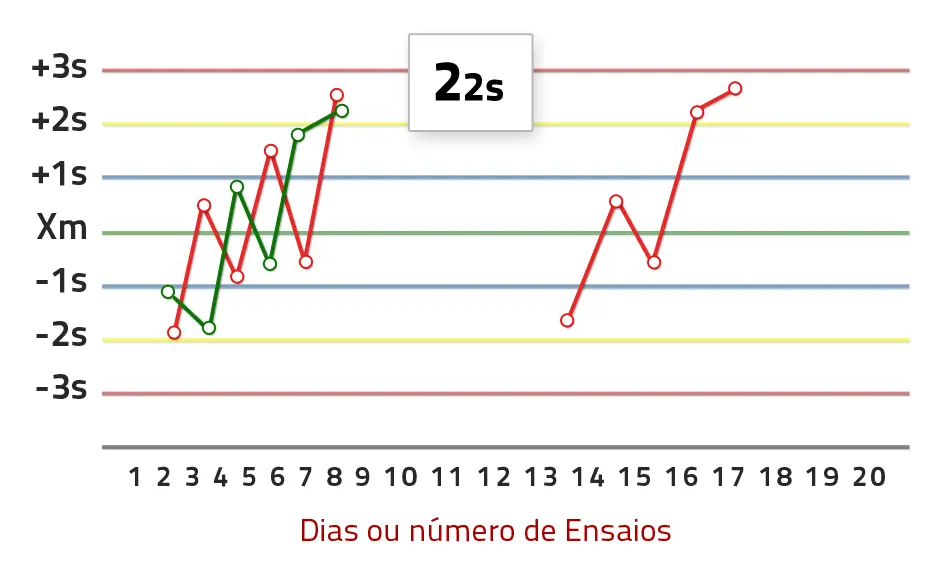
Results cannot be released when the values for one of the controls exceed the limits of Xm + 2s or Xm − 2s in two consecutive observations.
The rule is initially applied in the same batch for the values of 2 controls (in the same analytical run, with two levels). Results are not released when the values of 2 controls exceed the +2s or −2s limits on the same day.
The rule can also be applied to two consecutive observations (2 days) for the same control (with only one level, in consecutive runs). Violation indicates a systematic error.
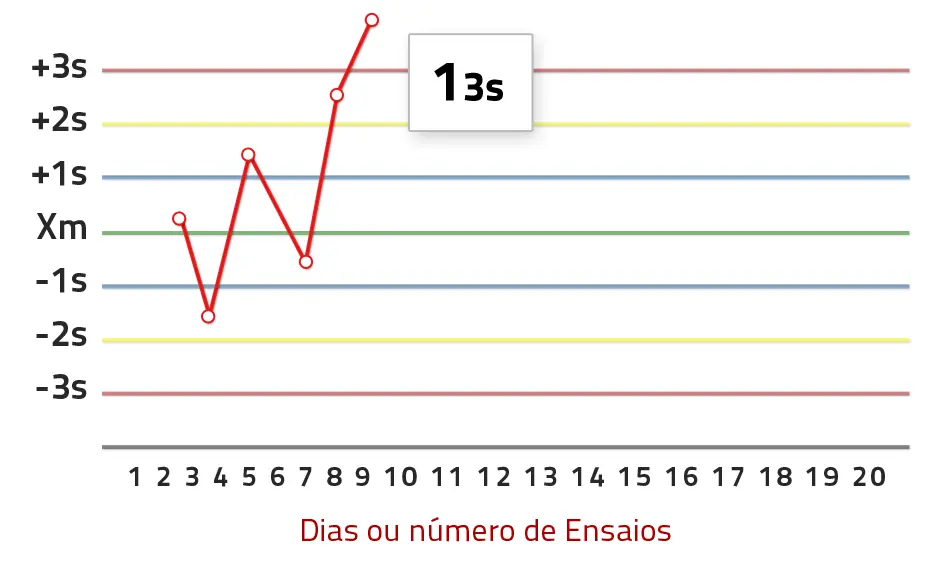
Means that the results must be rejected because the value of one of the controls exceeds the limit of Xm ± 3s. This is a criterion adopted as a rejection limit for the Levey-Jennings map.
The run is rejected when a single result exceeds the 3s limit.
Violation of this rule indicates an increase in random error, but could eventually mean a large systematic error.
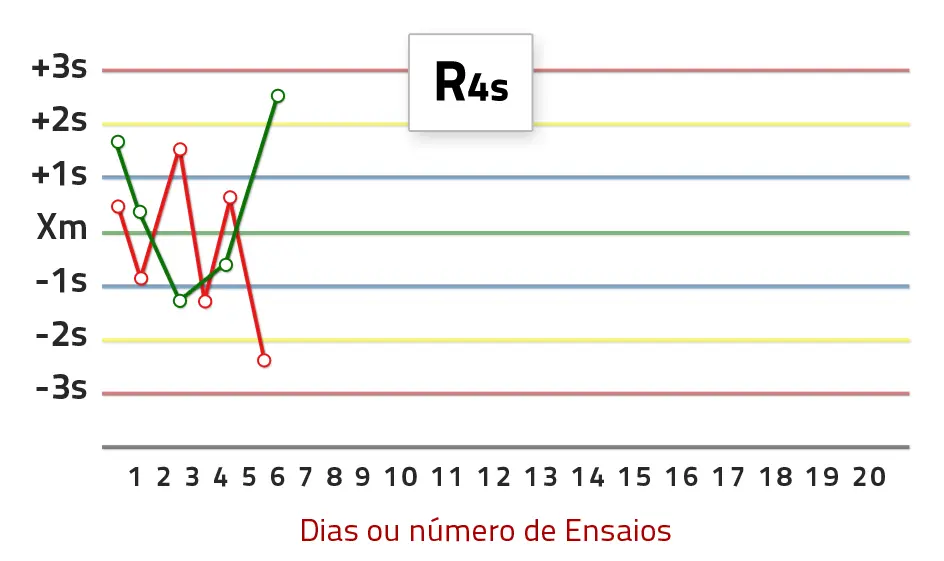
The values obtained must be rejected when the difference between the data from the two controls is greater than 4s. Only applies to two levels, in the same run.
When the value of one control exceeds +2s and the value of the other control exceeds −2s, each observation exceeds 2s, but in opposite directions, making a difference greater than 4s.
It is an indicator of the occurrence of random errors.
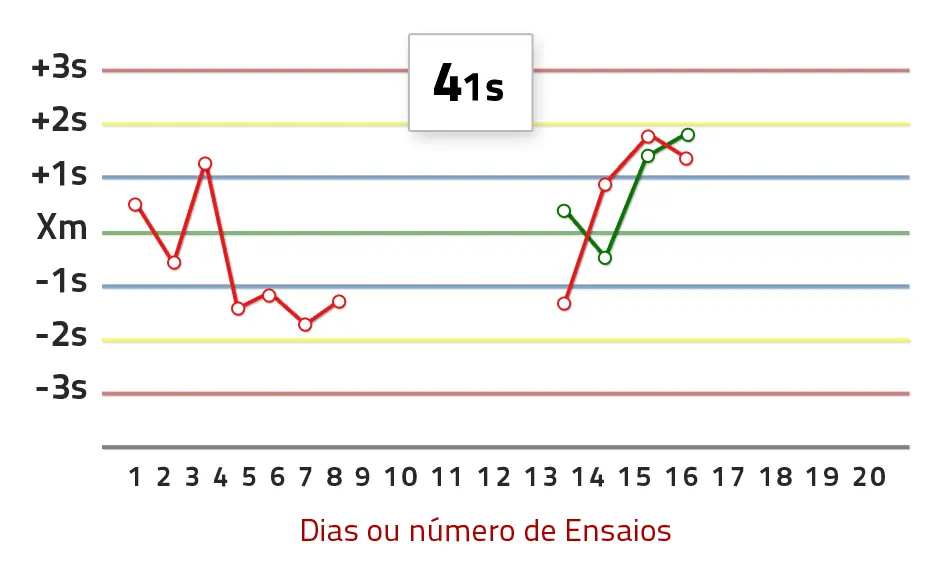
Results should be rejected when 4 consecutive values from a control exceed the same limits — that is, Xm + 1s or Xm − 1s.
These consecutive observations can occur with the values of one control and require observation for 4 consecutive days, or at two levels, crossing with the values of the other control (2 days). Violation indicates a systematic error.
It is clearly seen in the graph that there is a systematic error. With two levels, error detection is earlier, in just two days.
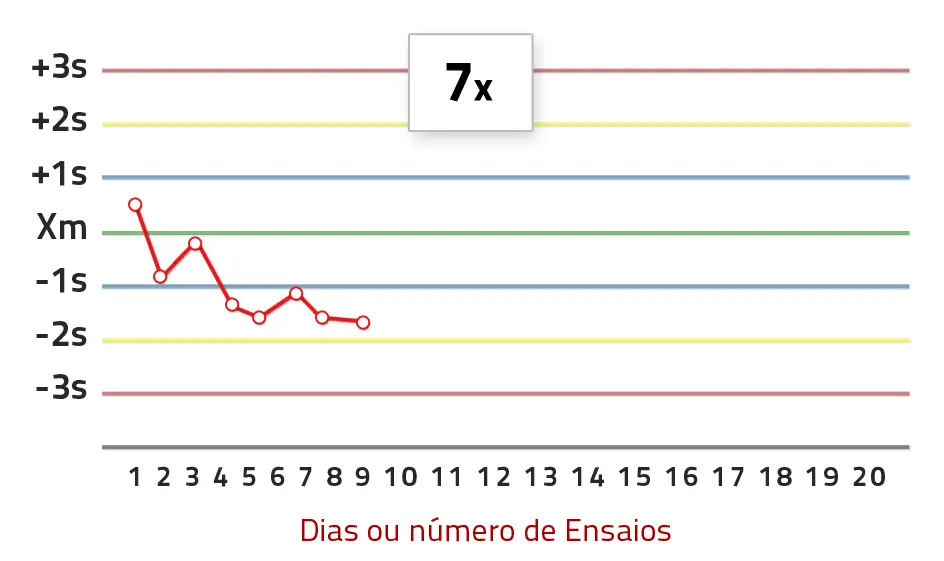
This rule is violated when the control values are on the same side of the average for seven consecutive days, and it is not necessary for the limits of ±2s or ±3s to be exceeded.
This rule is an indicator of the occurrence of a systematic error and indicates that the system has lost stability and that the results obtained from patient samples must be rejected.
Again the graph indicates a systematic error, with values lower than the average value.
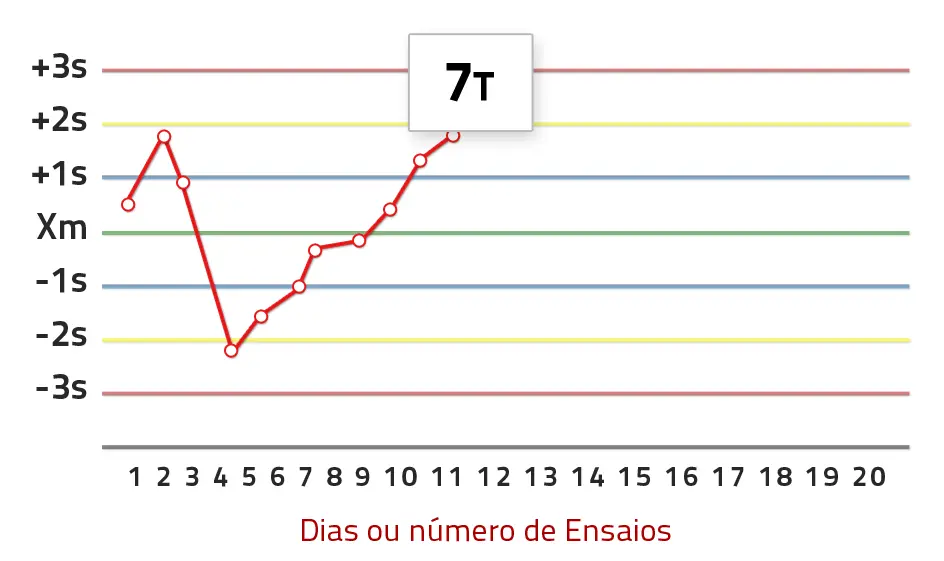
This rule is violated when the control values on seven consecutive days show an increasing or decreasing trend, and it is not necessary for the limits of ±2s or ±3s to be exceeded.
This rule is an indicator of the occurrence of a systematic error and indicates that the system has lost stability and that the results obtained from patient samples must be rejected.
The trend has the right direction and often does not go beyond the limits, but it indicates a problem.
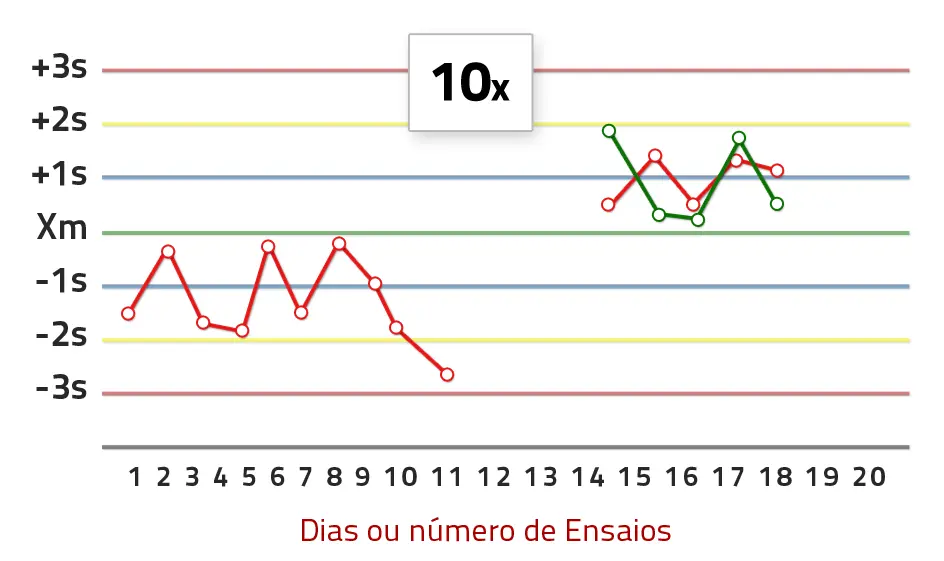
Results cannot be released when control values are on the same side of the 10 consecutive day average. These observations can occur for 1 control (10 days) or for 2 controls (5 days for level 1 and 5 for level 2).
Results should fluctuate around the average. The rule indicates a loss of this oscillation, indicating that the average has changed.
Other Multiple Rules
In control environments where three materials are included, other rules may apply:
Occurs when 2 of three control materials have their results exceeding the mean by 2 SD, plus or minus. Indicates rejection.
Occurs when 3 consecutive measurements exceed the mean value by 1 SD on the same side. Indicates rejection.
When 6 consecutive measurements fall on the same side of the average. Indicates rejection.
You must define a more detailed control protocol to work with a greater number of materials and adopt these rules.
Control rules and error types
When violated, the rules point to the type of error, which contributes to understanding the problem and finding the root cause. It is necessary to understand the meaning of the violated rule and the extent of involvement — whether a problem affects only 1 level of control, more than 1 level, only 1 analyte and more than 1 analyte.
| Rule | Error Type | Notes |
|---|---|---|
| 1:2s | — (Alert) | Alert only; does not imply rejection |
| 1:3s | Random | May possibly indicate a large systematic error |
| R:4s | Random | Exclusive application for two control levels, same run |
| 2:2s | Systematic | Two controls exceed +2s or −2s on the same day |
| 4:1s | Systematic | Early detection with two levels (only 2 days) |
| 7x | Systematic | Same side of average in 7 consecutive runs |
| 7T | Systematic | Increasing or decreasing trend in 7 consecutive runs |
| 10x | Systematic | Same side of average in 10 runs (or 5+5 with two levels) |
Random errors — highlighted by 1:3s and R:4s. They are more challenging to find the root cause. They can be caused by operator failures in manual techniques, instability in the electrical energy supply, changes in incubation temperature, factors related to reagents, problems with sample aspiration, etc. Always write down the solution found, to consult in other situations.
Systematic errors — are highlighted by most of the rules, such as 2:2s, 4:1s, 7x, 7T and 10x. Because they have the right direction, they are errors whose causes are more easily perceived. Other analytes from the same system may present the same problem.
Examples and Interpretations
Some of Westgard's rules will be discussed with real examples in this section. The control chart shows the runs for level 1 in red, for level 2 in blue and, when applicable, level 3 in green.
A black background box provides information about the point highlighted on the graph — it shows control material data, the analytical run value and the Z value (number of deviations in which the point is away from the Xm line). Sometimes it indicates the rules violated, if any.
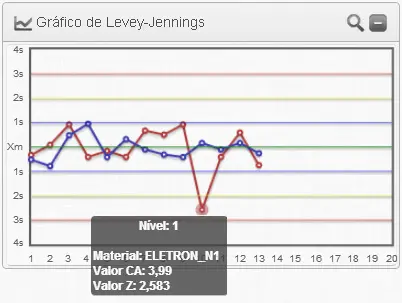
In run number 10, for level 1 (in red) the result exceeded the limit of 2s less — violation of the 1:2s rule. It is a rule that must be specified as Alert, given that such a situation can occur in around 5% of the runs in control.
As level 2 appeared to be in control, it was decided to observe, without intervening. Later runs proved to be in control. The system was considered stable.
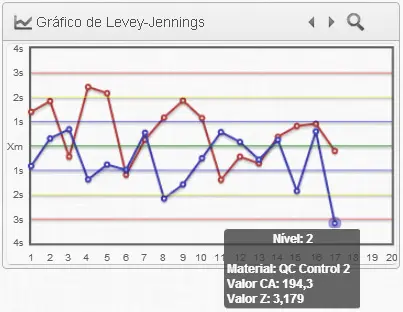
Violation of the 1:3s rule in run 17, for level 2. The value Z = 3.179 means that the point is 3.179 deviations from the Xm line.
The analyst understood that the error, of a random nature, could be due to inadequate homogenization of the level 2 control — a recently opened vial, which was frozen.
Take care to ensure adequate thawing and homogenization. A new run showed results in control. The outlier value was replaced in the IQC program by the value obtained in the new run. The previous value must be kept in a database record for traceability purposes.
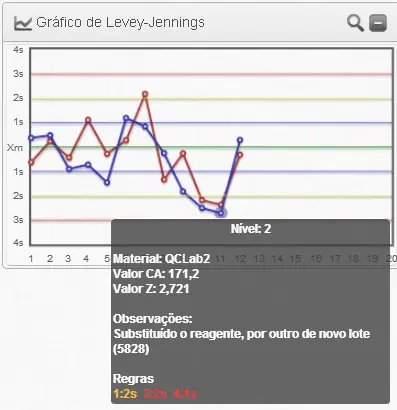
The 2:2s rule was violated in run number 10. No action was taken that day. The problem was repeated (run 11) and confirmed that it was a systematic error, which occurred only with that analyte and affected both levels of control.
The analyst recognized that the specific problem was in this analytical environment and attributed the cause to deterioration of the reagent. Decided to replace the lot. The result indicated that it was correct, as the new run was in control (run 12).
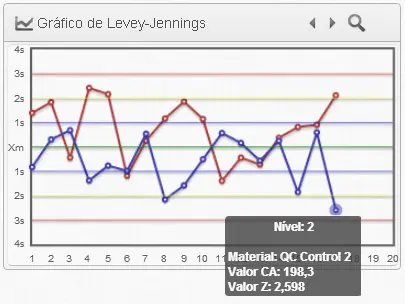
Run number 13 indicates a significant change in the analytical system, systematically over the last few days — hence the violation of 4:1s for 2 levels (runs 12 and 13). There was also a violation of another systematic error indication rule (2:2s) in run 13.
The analyst interpreted it as having lost calibration, after analyzing the history of this analyte. The calibration was redone, and the results from run 14 and following were accepted.
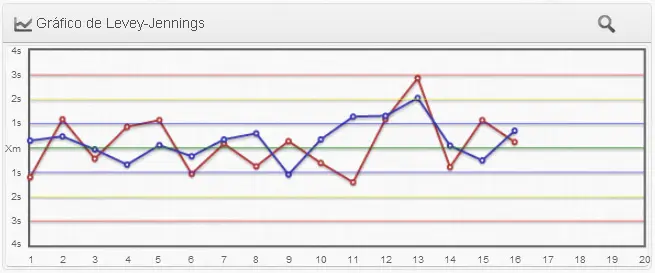
Rule R:4s was violated, which is a rule that applies exclusively to two levels of control, in the same analytical run.
The violation occurs when the range (Range) existing between the results of the two levels in the same run is greater than 4 SD. It represents an important random error and the run must be rejected and the cause analyzed.
Random errors are more challenging. Always write down the solution found, to consult in other situations.
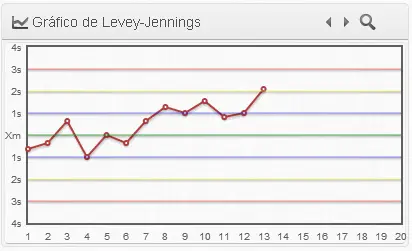
The 7x rule indicates a systematic error, which may or may not exceed the 2DP limit. It is characterized by not exhibiting the oscillation of points around the mean, as would be expected from the normal Gaussian distribution.
The analyst interpreted it as having lost calibration, although it cannot be said for sure.
This rule is similar to 5x and 10x. Points out a deviation from the average.
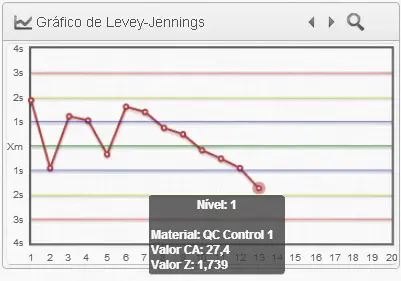
Violation of rule 7T (Trend) indicates a systematic error that has the right direction. Note that it can occur even without the limit on the control chart having been exceeded. The last result also shows a Z value of less than 2SD.
The analyst attributed the cause to probable deterioration of the reagents and replaced the batch. This graph was obtained during the preparation phase, but it is now possible to interpret the phenomenon that caused the nonconformity only through visual interpretation.
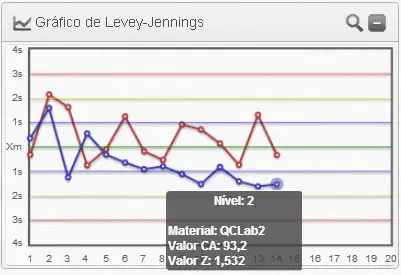
This is another rule that points to systematic error, because 10 successive results are on the same side of the average. Here there is a very peculiar situation — it occurred with only one level of control, in a system working with two levels.
The current average (calculated over the 14 run results) was 109.09, well below the usage average of 121.70. The analyst understood that the problem appeared to be with the control material at the pathological level. There would have been degradation of the AST enzyme in this material — the vial was forgotten on the bench a few days earlier.
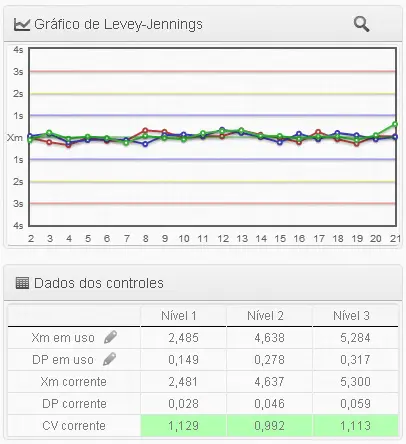
Some analysts set control chart limits much higher than would be reasonable for their analytical systems. They believe that this way they would not be bothered by occurrences of rule violations and "would look good in the photo".
The example is for the analyte RBC (×million). The three levels of control have results that lie on very horizontal lines, because the limits (SD in use) are much wider than the analytical system has due to its own imprecision.
Working with very wide limits reduces the ability to detect problems, giving the false impression that the system is always stable.
Conclusion and Additional Resources
The use of Multiple Rules must be periodically reevaluated for each analytical system and the specification of its set can be modified. Changes in the reagent and equipment may require fine-tuning to detect problems, depending on the new operating environment. Using the same standard for all analytes at all times should be avoided.
You may now be interested in studying two other topics:
- Approaches to Internal Control strategies. Interpretation of the Levey-Jennings graph and analysis of the Coefficient of Variation.
- Attitudes to deal with nonconformities. How to find the causes of problems.
Did you like it? Share this content
Published February 2013
Bibliography
- Westgard JO, Barry PL, Hunt MR, Groth T. A multi-rule Shewhart chart for quality control in clinical chemistry. Clin Chem 1981;27:493-501.
- Westgard JO. Basic QC Practices. 3rd Edition. WQC 2010.
- Marquis P. Common Misconception in Medical Laboratory Quality Control. At www.multiqc.com
- CLSI C24-A3. Statistical Quality Control for Quantitative Measurement Procedures: Principles and Definitions; Approved Guidelines-Third Edition. Clinical and Laboratory Standards Institute, Wayne, PA, USA, 2006.