Start with the process you need to control
A spreadsheet can support learning, the organization of a few controls and specific calculations. Its reliability depends on validating formulas, permissions, and reviewing changes. The choice must consider volume, team and need for traceability.
| Appearance | Spreadsheet Is | QualiChart |
|---|---|---|
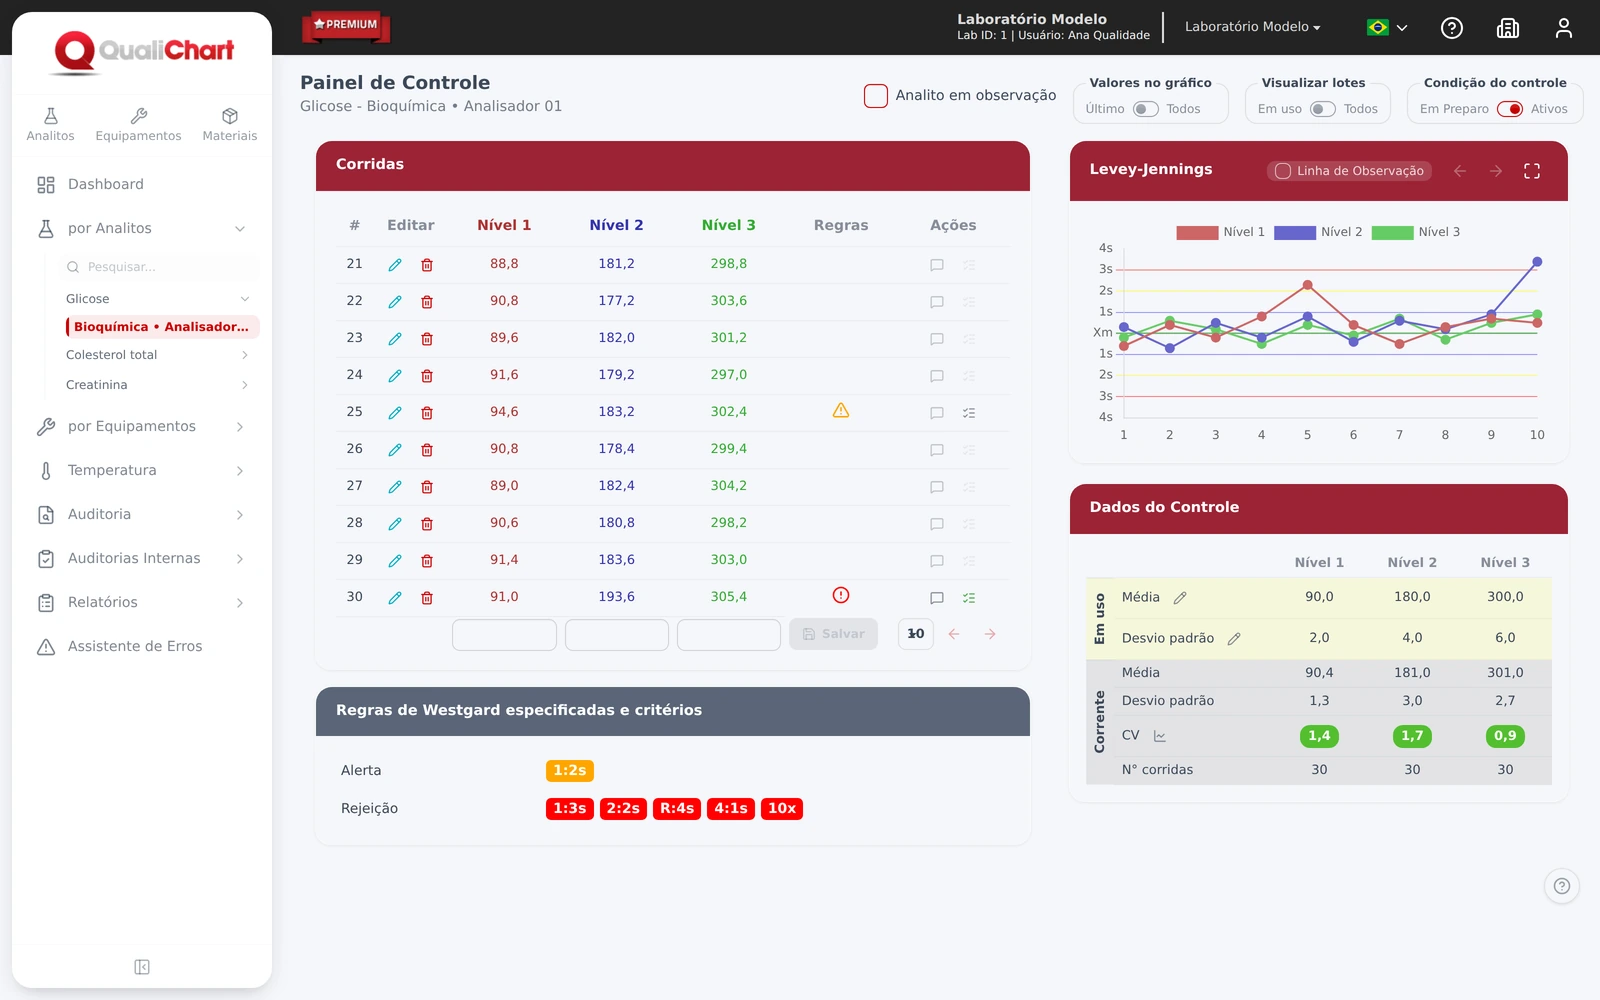
| Calculations | Formulas created and verified by the team | Mean, standard deviation and CV calculated by the system |
| Graphics and rules | Manual configuration and condition validation | Levey-Jennings plots and test of configured rules |
| Review and investigation | Records organized in specific fields or files | Record of investigation and actions along with the control history |
| Team | Permissions and versioning need to be structured | Accounts, permissions, and system activity logs |
| Maintenance | The team maintains formulas, files and copies | Features maintained in software and support as per plan |
When does it make sense to evaluate change?
When checking formulas is time consuming, records are in multiple files or it is difficult to reconstruct a decision. Compare the total cost of the routine and the ability to maintain evidence in addition to the license fee.
RDC 978/2025 requires processes and records; simply purchasing software does not ensure compliance. Evaluate your process and see QualiChart in a demonstration.
Test the same routine in both environments
Choose a set of demonstrative results with three levels, a violated rule and a corrective action. Record how long it takes the team to enter, check, interpret and document. Also count the steps that depend on copying data, correcting formulas, or searching for documents. The comparison is concrete without assuming equal savings for all laboratories.
- Check whether each result maintains the link with analyte, equipment, material and level.
- Change a mistaken entry and see how the change can be recovered.
- Open the history on another user and check which decisions are visible.
- Find the violated rule, investigation, and post-verification evidence.
- Prepare a period report without reconstructing memory information.
Consider maintenance effort. In the spreadsheet, someone needs to validate changes to the formulas, distribute the approved version, and organize copies. In the software, evaluate the access, export, training, and support features that are part of the contract. These costs are part of the comparison with the license.
When there are multiple units
Independent files can use different names, units, or limits. Before comparing results between units, check the standardization of records and the comparability of analytical systems. A single panel facilitates consultation, but does not make results technically equivalent by itself.
In the demo, request a journey from initial registration to review and report. If your team uses an LIS, also evaluate what it already solves and what gaps would remain. import and integration must be checked in your scenario, without assuming automatic connection to any equipment.
To evaluate the transition, start with a period and equipment, review the imported data, and record approval before expanding use. Compare plans and monitoring according to the team's needs.