
Analytical sigma New
Analytical sigma per level, calculated from your IQC data.
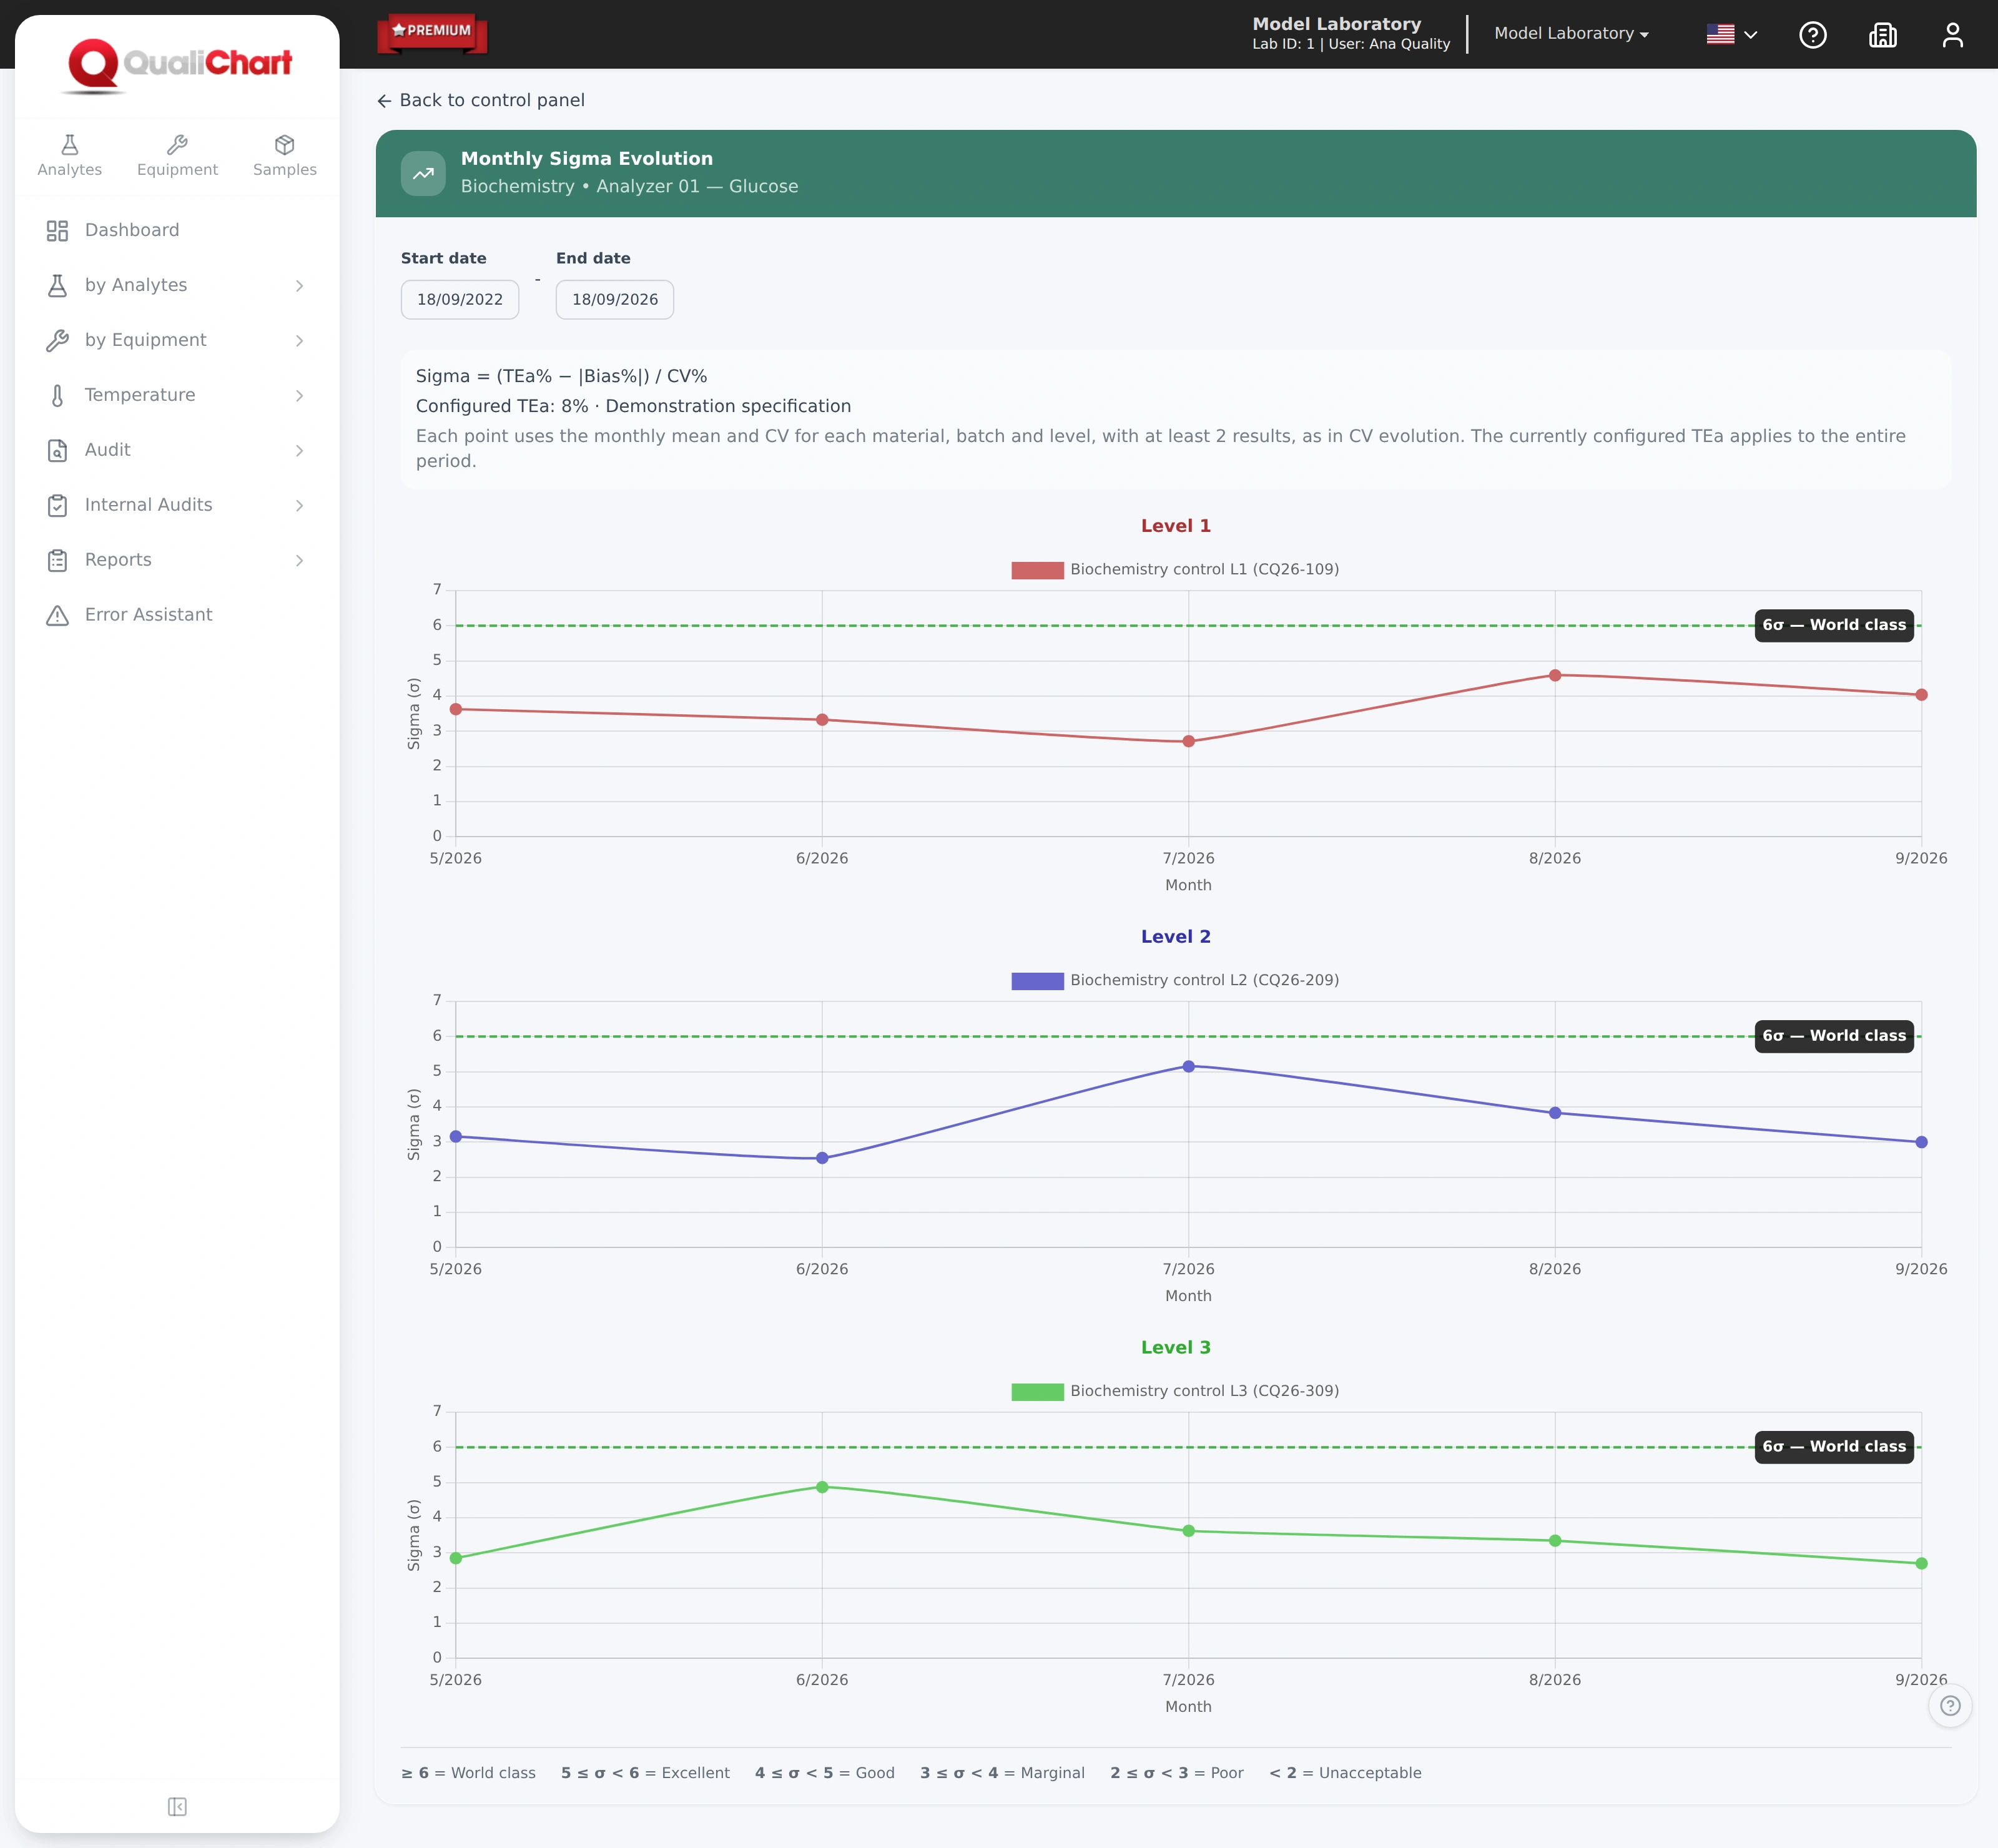
QualiChart combines the analyte's total allowable error, the bias against the insert target and the cumulative CV to show the performance of each level and how it changes month by month.
- σ = (TEa% − |bias%|) / CV%
- Monthly trend per material lot
- Percentage TEa, absolute TEa or both, with the source
In the laboratory routine
A performance indicator to guide QC planning
The sigma metric relates the quality specification adopted by the laboratory to the observed imprecision and bias. With it, the team identifies the systems that need more attention and supports revisions of the IQC plan.
-
The challenge
Calculations scattered across spreadsheets
Calculating sigma requires gathering the TEa, the target of each material and the CV for a period. Repeating the calculation per level, lot and instrument takes time and leaves room for transcription errors.
In QualiChart
The sigma of each level appears on the control panel, calculated with the analyte's TEa, the insert target and the CV of the series. When it cannot be calculated, the system states why.
-
The challenge
Specifications with more than one limit
Some sources define both a percentage limit and an absolute one. Applying the correct limit at each concentration requires care, especially at low levels.
In QualiChart
With both limits registered, QualiChart compares them in the analyte's unit and applies the larger one, showing the TEa used and the recorded source.
-
The challenge
The trend, not just the monthly figure
A single sigma value can hide a change in performance after a lot change or a calibration.
In QualiChart
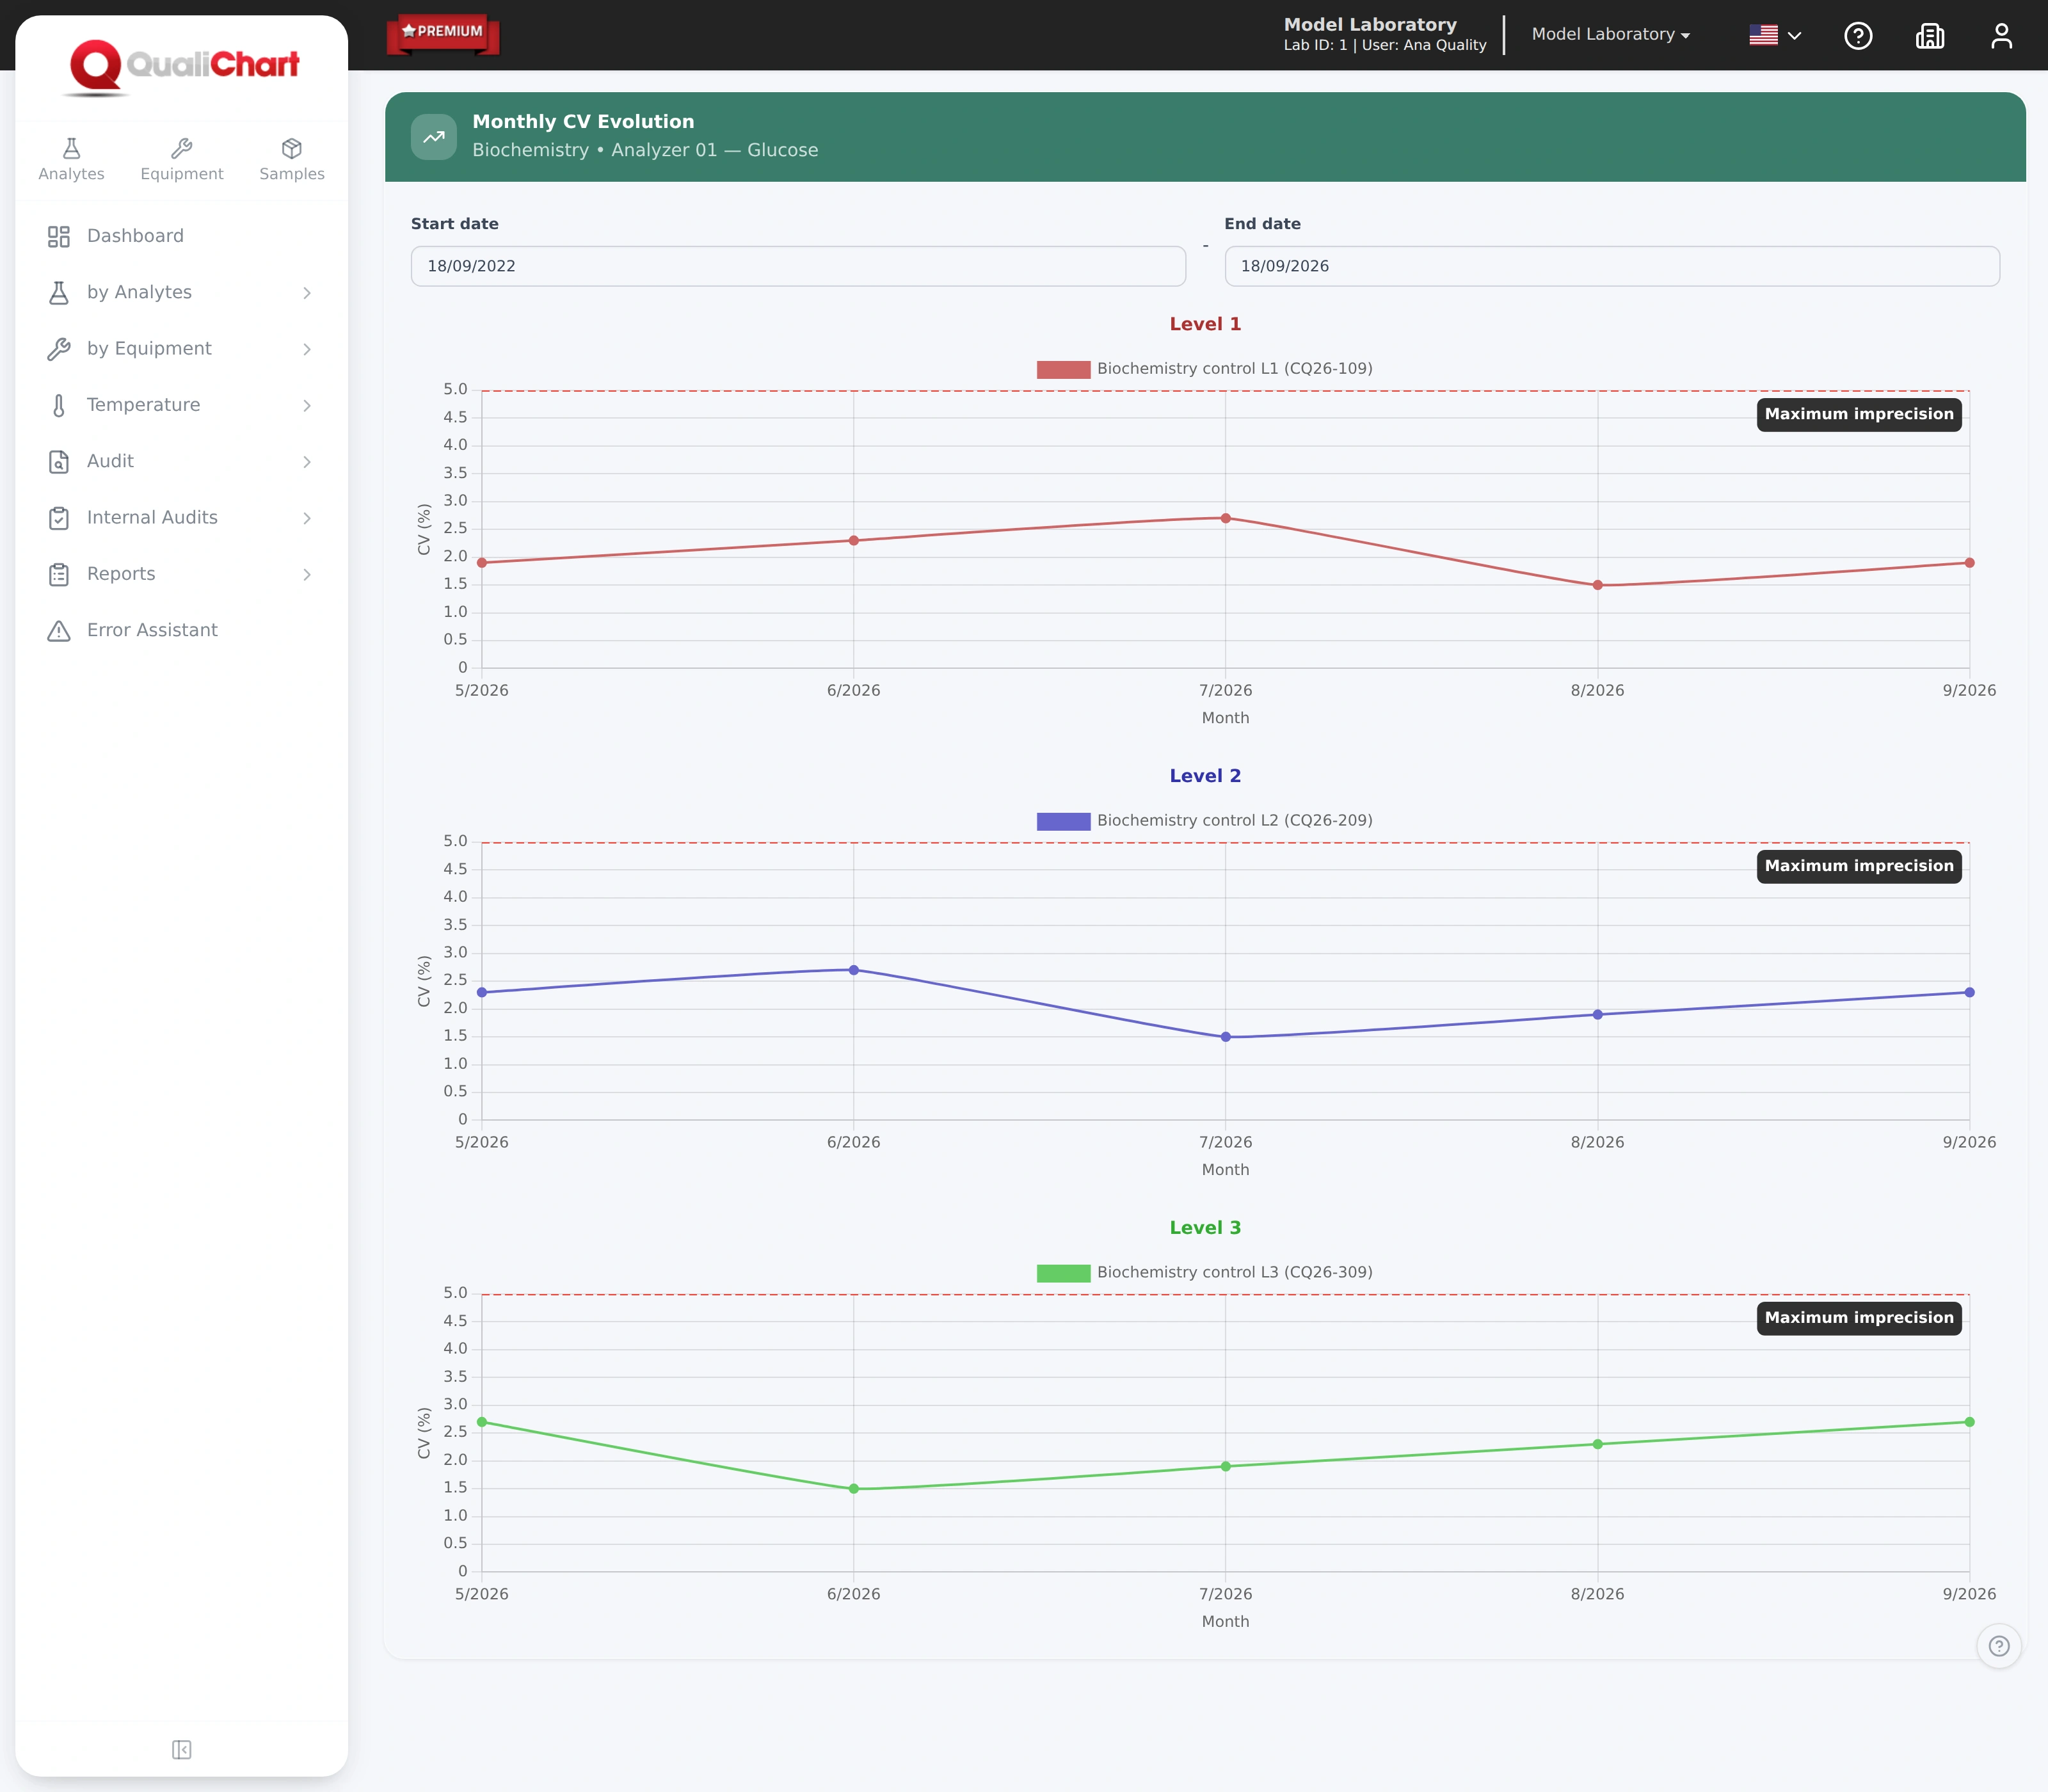
The monthly trend shows one chart per level, with one line per material lot and the 6σ threshold, next to the trend of the CV against the maximum imprecision.
How it works
How sigma is obtained in QualiChart
Record the TEa and its source
In the analyte setup: a percentage limit, an absolute limit or both, with the source, the performance tier and the version of the specification.
Enter the insert target
Bias is estimated against the target of the material tested at each level, never against the laboratory's own mean.
Follow it on the control panel
The Sigma row shows the value and classification of each level, from world class to unacceptable.
Analyze the trend
Compare months, lots and levels. Low sigma with a CV within the maximum imprecision points to bias: review calibration, reagent lot and target.
Capabilities
Analytical performance in a single number.
QualiChart calculates the sigma of each level using the TEa registered for the analyte, the bias against the package insert target and the cumulative CV: σ = (TEa% − |bias%|) / CV%.
- Sigma by level on the panelGraded from world class to unacceptable. When sigma cannot be calculated, the reason is shown.
- Percentage TEa, absolute TEa or bothRecord the source of the specification. With both limits, the larger one in the analyte unit applies.
- Monthly sigma evolutionOne chart per level, with one line per material lot and the 6σ threshold.
- CV evolutionThe CV for each month compared with the analyte's maximum allowable imprecision.
- Measurement uncertaintyStandard and expanded uncertainty (k=2) estimated from IQC data, in a report.
Requirements and good practice
Technical and regulatory basis
- RDC 978/2025 · Art. 87
Quality control management must be documented, and its effectiveness must be monitored by the technical manager through performance indicators.
Read the source - RDC 978/2025 · Art. 180, item II
Acceptance and rejection criteria for control results must be defined by type of analyte and according to the methodology used.
Read the source - ISO 15189:2022 · 7.3.7.2
Internal quality control must verify that the intended quality of results is attained, according to criteria defined by the laboratory.
Read the source
Sigma is an evaluation tool. The quality specification (TEa) and the source adopted are the laboratory's choices, and registering the TEa does not automatically change the Westgard rules.
Which formula does QualiChart use?
σ = (TEa% − |bias%|) / CV%. Bias is estimated against the insert target of the material tested, and the CV is that of the cumulative series for that material, level and instrument in the selected phase.
Why does sigma show as N/A?
The calculation requires a registered TEa, the insert target, enough runs (the same minimum as the CV) and a valid mean and CV. The tooltip indicates which condition is missing.
Which TEa should I use?
The choice is technical and depends on clinical use and the source adopted, such as biological variation, state of the art or proficiency testing criteria. Record the source and version in the analyte setup.
Does QualiChart estimate measurement uncertainty?
Yes. The uncertainty report estimates standard and expanded uncertainty (k=2) from the IQC data in the active phase. Check the assumptions before using the estimates.
Further reading
Related content
Your next step in quality control
Put QualiChart to the test. Free for 30 days.
Create your account and evaluate QualiChart in your laboratory. Do you prefer a guided introduction? Request a demo with our team.