

About the author

Silvio de Almeida Basques
Author of materials on internal quality control and information systems for laboratories.
Training and experience
Doctor, with residency and postgraduate degree from the Federal University of Minas Gerais and specialist title from the Brazilian Society of Clinical Pathology. Retired professor at the UFMG Faculty of Medicine.
Introduction
It is imperative to determine the root cause for the data outlier and how to adopt the possible correction.
Source: Wikipedia
A major challenge for clinical laboratory professionals is when they are faced with situations identified as loss of control, that is, they receive an alert indicating a non-compliance. The laboratory must establish strategies to deal with these situations.
Many people carry out all sorts of repetitions at this time, be it control, a new rate of material, in short, an action that is considered objective and is immediately within their reach. Caution must be exercised at this time because acting in this way can characterize a random attitude, devoid of foundation or rational basis and therefore less resolute.
Anyone who has read our article “3 approaches to analytical quality management” will remember the PDCA cycle (Plan, Do, Check, Action) and that control, the third step, requires an attitude of reviewing the system, finding and correcting the root cause.
Develop a strategy
Having a strategy to deal with the outlier situation constitutes a very important approach to finding the root cause and thus making it easier to adopt correct and effective corrective measures.
Attitudes such as simply repeating the control analysis without analyzing the situation is not a good practice for a laboratory that plans and takes care of quality strategies. Although we must admit, it may happen to be the outlier result caused by degradation of the analyte itself in the vial of control material that is in use, or even contamination of that vial. In this case opening a new bottle may be the effective corrective measure and should be documented in run comments.
If quality control is well planned and the Quality Manager expands his knowledge test by test, his view of the analytical systems will be so consistent that it will enable clarity and greater accuracy in the search for solutions. Solving control problems requires knowledge and attitudes. It is up to the laboratory quality manager, a higher-level professional, to discover the causes and solve the problems.
Attitudes
7 Attitudes
- Inspect the control chart and rules violated in detail
- Analyze possible causes of errors
- Perform interventions on the system to correct the problem
- Note the measures taken for correction
- Perform new analytical run, for controls and patient samples
- Test the new data
- Interpret the result of the last assessment and decide on referral
Inspect the control chart and rules violated in detail
Visual interpretation of the control chart can be very enlightening. We can infer whether there is a trend, which indicates the type of systematic error, or whether the plot suggests a random nature.
Violated rules also provide important indicators of the type of error:
- Rules that evaluate consecutive observations — such as 2:2s, 4:1s, 7x, 10x and 7T — usually indicate systematic error.
- Rules that test for broadening of the Gaussian distribution — such as 1:3s, R:4s — generally indicate random errors.
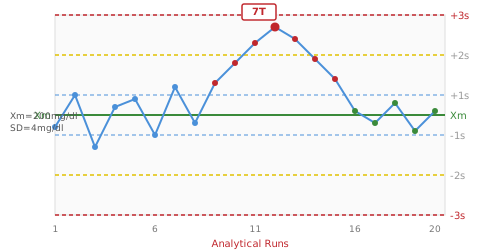
Figure 1 – Control chart with violation of the 7T rule (systematic error with an upward trend)
Analyze possible causes of errors
Having identified the type of error, whether RANDOM or SYSTEMATIC, go in search of the root cause. Systematic errors are more frequent, are caused by persistent problems and are easier to resolve. Random errors do not have a defined meaning or direction, and are therefore more difficult to find the root cause.
Carry out an accurate review of the causes of error. Spend a little time on the analysis, to save on time and materials, avoiding fruitless repetitions that increase your costs.
Mainly evaluate two aspects:
- If the problem affects other tests that are run on the same device — what we can call the “common denominator” for the different analytical systems.
- If there has been recent intervention on the equipment, from preventive maintenance, any damage, to changing reagents.
Remember to check the last movement in relation to the device (recent maintenance), reagent (new reagent, new batch), calibration, etc. Use information about types of errors, in a list, to remind you of the possibilities.
Reviews
Evaluate and learn about your analytical system and its performance. Use records of nonconformities for the analyte as a way to recall other violations (even old ones) to detect possible recurrences of the same problem.
Consider the option of analyzing non-conformities, root causes and corrective measures previously adopted. Remember the Pareto Principle which states that 80% of problems have less than 20% of causes. It is a valid axiom for IQC in the clinical laboratory.
Perform interventions on the system to correct the problem
Based on the type of error and the search for the root cause, carry out targeted interventions in the analytical system. Nonspecific or random interventions are not effective and can mask the real problem.
Reviews
Avoid simply replacing the vial of control material, or using new reagent, which may supposedly give faster results. In fact, it may be that we are just postponing effective measures.
However, it is always possible that an analyte has deteriorated in a material during use and by analyzing another vial the solution to the problem can be found, which in this case would be in the material that has the function of controlling the stability of the system, but itself would have lost stability.
Note the measures taken for correction
Having the habit of always recording is of great importance. Only then will you be able to better solve future problems with the same analytical system.
In automated computer control systems, look for the recording form in “Comments” or “Observations” in the analytical run, to note the resolving interventions. Also note interventions of other types, such as preventive maintenance, changing reagent batches, calibrations, changing the needle, etc.
Reviews
Recording each corrective action will provide you with a source for queries about errors and corrections in that analytical system. You may find it appropriate to repeat a previously adopted corrective measure that was successful.
Get used to also taking notes for later revisions, to guide reasoning about recurrences of the same problem. If a problem is recurrent, you must take care to establish a subsequent analysis procedure, to adopt preventive measures. Consider holding a discussion with the equipment's technical consultant, or with the reagent manufacturer's SAC.
Perform new analytical run, for controls and patient samples
If the criterion was to reject the analytical run, a new run must be carried out for the control levels of that analyte(s), after having taken rationally defined attitudes to review the analytical system.
This repetition is not meaningless, because it aims to verify whether the measure adopted was in fact sanitary and resolving. If the problem factor remains, it will continue to negatively influence patient outcomes.
Reviews
If the nonconformity treatment criterion was rejection, you must perform a new run for all implemented levels, even if the rejection was motivated by just one of them. The interpretation is that the analytical run was rejected and consequently all control levels analyzed in that run must be rejected.
Performing a new run is very important and necessary. ALWAYS after analyzing possible causes.
Test the new data
Your control methods (computer program) must allow you to enter a new value, replacing the previous one. After entering the new value, all rules must be tested and the graph plotted. The original value, which caused a rule violation, must be preserved in the record and made available for history and review.
Reviews
The value that caused the violation remains archived, but is not used for calculations of current values, for interpretation of the Coefficient of Variation.
Archiving the data that generated the nonconformities serves to document IQC performance and in subsequent reviews, to guide reasoning about recurrences of the same problem.
Interpret the result of the last assessment and decide on referral
If an outlier persists with a second result, you must be even more careful and review the entire system, check the check list of error causes and try to open your thinking to look for other possible causes that have not yet been identified.
It is very important that the solution to the problem did not occur by chance, but rather as a result of your intervention in the system. If the last result is in control, you have the support to consider that the patient samples will have analytical quality results if they are treated in a similar way to the control material.
Reviews
Using this analysis, it is possible to classify the type of error. Systematic errors show trends — they are changes that occur gradually over time. Random errors point to greater variability in the system and mean broadening of the Gauss curve.
Whenever contacted by its employees in a situation of persistent nonconformity, the Quality Manager must analyze the problem adopting a systemic view of the analytical process:
- Inspect the control chart, rules violated, and error type.
- Relate the type of error with the potential causes.
- Consider other analytes in a multiple test system — if there is an incidence with others, investigate the common denominator (equipment, filters, lamp).
- Relate the problem to recent interventions — systematic errors are often related to problems with reagents and calibration.
- Record measures adopted. Always record, so you can consult them later.
Conclusion and Additional Resources
Develop good habits and share them with your team. Good attitudes are incorporated into people's daily lives and translate into appropriate referrals naturally. Increase the effectiveness of your internal control and confidence in your systems and their results.
Quality is not an act, it is a habit.— Aristotle
Did you like it? Share this content
Published May 2012
Bibliography
- Basques, JCA. Using Controls in the Clinical Laboratory. Labtest Diagnóstica, 1997.
- Ricos, C. et al. Current databases on biological variation: pros, cons and progress. Scand J Clin Lab Invest 1999; 59:491-500.
- Ricos, C et al. Biological variation database, and quality specifications for imprecision, bias and total error. The 2008 update http://www.westgard.com/guest36.htm
- CLSI C24-A3. Statistical Quality Control for Quantitative Measurement Procedures. Clinical and Laboratory Standards Institute, Wayne, PA, USA, 2006.
- Westgard JO et al. Basic QC Practices 3rd ed. Madison WI: Westgard QC, 2010.
- Fraser CG. Generation and application of analytical goals in laboratory medicine. Ann Ist Super Sanita. 1991;27(3):369-75.


Reviews
The control chart is an essential tool in quantitative internal control and the professional must become familiar with it. It provides a lot of information and has a great pedagogical effect, allowing information about control events to be shared with all employees.
It is good control practice to always inspect the Levey-Jennings chart. The practice of simply comparing the control result with a range recommended by the manufacturer of the control material is a fragile criterion and has a low problem detection rate.
For example, a deviation from the mean caused by loss of calibration may not be detected for many days, simply by comparing the result with a range. Analyzing the control chart or testing the rules (e.g., 4:1s rule) reveals the problem you can solve. This is what is expected from a control system.
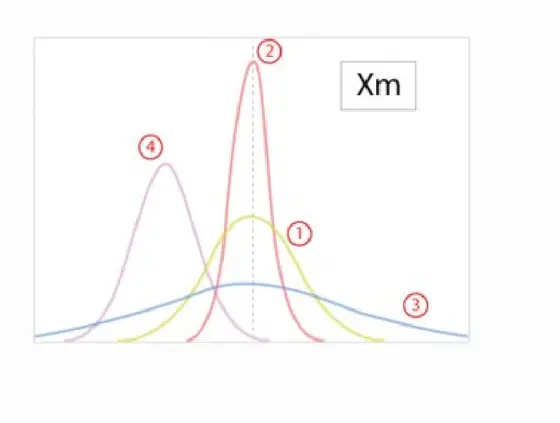
Figure 2 – Types of distribution and what they indicate
Acceptable Gaussian distribution, suitable mean. CV below the maximum print allowed.
Very good variability (small), values close to average. CV comfortably below the limit.
Wide distribution, very dispersed results even around the average. Indicates random errors.
Shift from the mean to minus. Good apparent variability, but system with problems. Indicates systematic error.