What does the sigma metric summarize?
The metric relates a specification of total allowable error (TEa) to the bias and imprecision observed in the method. It can help compare performance against a previously chosen goal. The number alone does not define the clinical quality of a test.
How to calculate
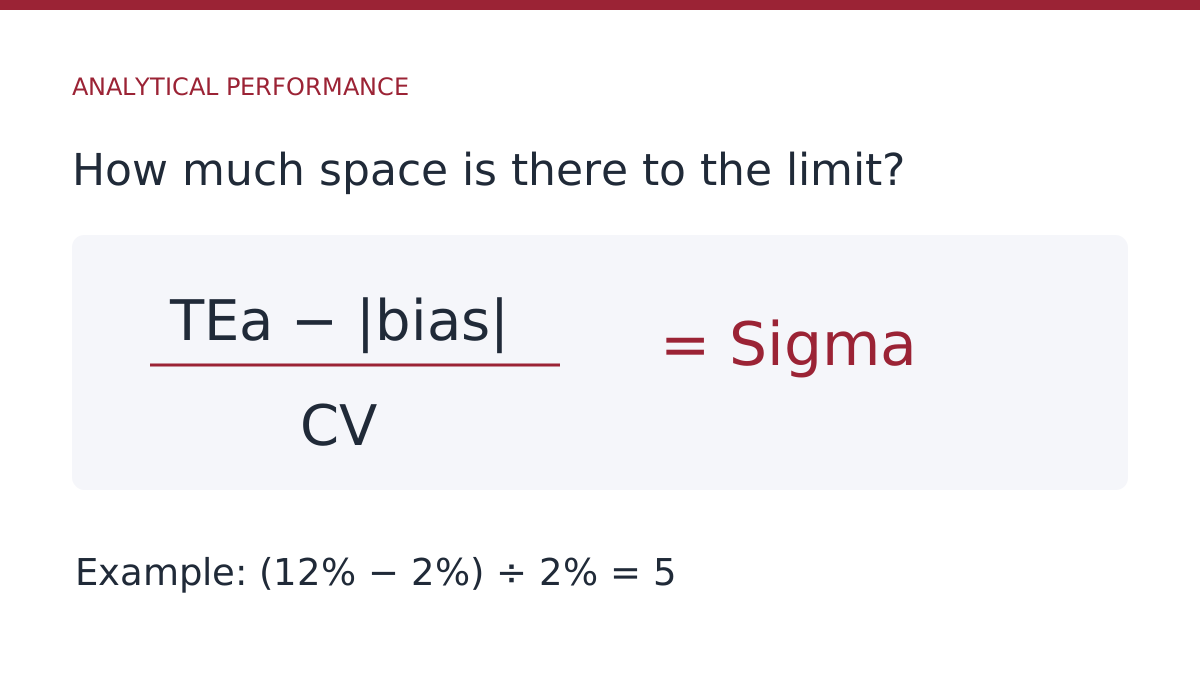
When the three quantities are in percentages, the usual form is: sigma = (TEa − |bias|) / CV. For TEa of 10%, bias of 1% and CV of 1.5%, the result is 6. Do not mix absolute concentration values with percentages.
Check data before interpreting
- Document where TEa came from and what clinical use it was chosen for.
- Use a CV representative of the concentration level and routine conditions.
- Identify how bias was estimated and the appropriateness of the comparison value.
- Calculate separately when levels and conditions have different performance.
If the bias exceeds the TEa, the result will be negative. This should not be hidden or automatically converted to zero: review the data, specification and performance before defining actions.
From metrics to control plane
Take the result to IQC planning discussion, along with control frequency, number of levels, rules, risks and volume of tests. Compare performance over time against documented criteria.
References: Westgard: Control Rules Best Practices and Westgard Sigma Rules. See also how to choose TEa and how to calculate CV.
Compare scenarios with the same specification
For an exercise, adopt TEa of 12%, bias of 2% and CV of 2%. The metric is (12 − 2) ÷ 2 = 5 sigma. If the CV rises to 2.5%, maintaining the other terms, the result drops to 4 sigma. The 12% limit is a textbook assumption, not a recommendation for an analyte.
| Scenario | TEa | |Bias| | CV | Sigma |
|---|---|---|---|---|
| Example reference | 12% | 2% | 2% | 5 |
| Greater dispersion | 12% | 2% | 2,5% | 4 |
| Biggest bias | 12% | 4% | 2% | 4 |
| Most demanding criterion | 8% | 2% | 2% | 3 |
The last scenario shows why two sigma numbers should not be compared without the source of TEa. The tool and the method may be the same; changing the specification changes the result. Don't choose the specification just to get a higher sigma.
Record the origin of each term
Document analyte, unit, concentration level, period, and number of observations used to estimate CV. For bias, record the reference value, how it was assigned, and whether the comparison is appropriate for the method and material. The difference in relation to a group of peers is not automatically equivalent to the bias compared to a reference method.
Use all terms in percentages, or consistently convert them to the same unit. If the absolute value of the bias is greater than the TEa, the numerator becomes negative: this deserves investigation; do not round to zero to make the indicator presentable.
The metric supports control planning, but does not alone determine the processing frequency, the number of levels or the rules to employ. Consider observed stability, clinical risk, and validated procedure. See the authors' explanation of the Westgard Sigma Rules.
Before using the calculator, review how to calculate CV and how to choose TEa. Then, compare the result with the graph and investigation records.