Uncertainty is not synonymous with error
The error is the difference in relation to a reference value. Uncertainty describes the dispersion of values that can be attributed to the measurand according to the measurement model. CV describes a portion of performance and does not alone replace a full assessment of uncertainty.
What information to organize?
- Measuring, matrix, unit and measuring range.
- Precision data representative of routine and relevant levels.
- Calibration information and metrological traceability.
- Assessment of bias and its contribution, when applicable.
- Model used, hypotheses and sources included or excluded.
How to Make Estimation Useful
Record the calculation method and the conditions under which the estimate is valid. Check whether major changes to the analytics system require reassessment. Communication of the result must indicate the magnitude, unit and information necessary for its interpretation.
Long-term control data helps to observe routine variability, but coverage of relevant sources needs to be examined. Avoid presenting “CV × 2” as a universal expanded uncertainty rule.
Take the topic to critical analysis
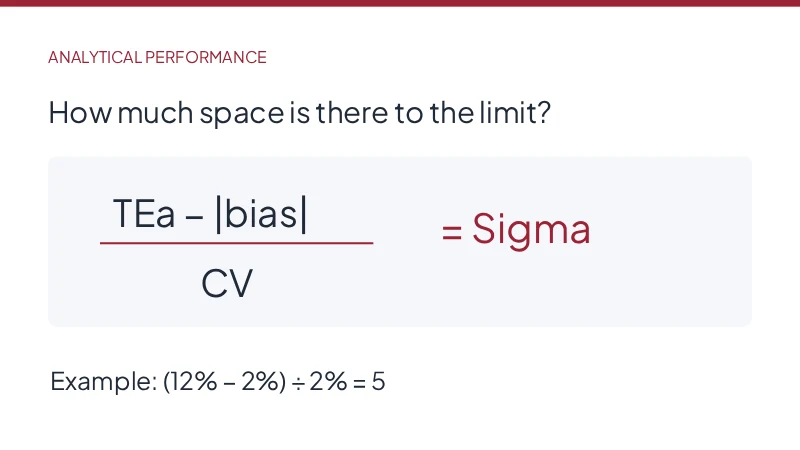
Discuss which decisions use the outcome, which sources dominate the variability, and which actions can improve the process. Compare the estimate with appropriate specifications, without confusing uncertainty with TEa.
References: Minimum requirements for estimating measurement uncertainty and EFLM technical material on uncertainty. See also permissible total error.
What does ISO 15189 have to do with this assessment?
ISO 15189:2022 deals with the quality and competence of medical laboratories. The assessment of uncertainty must be consistent with the measurement procedure and its intended use. Consult the edition adopted in the accreditation program; the year of the national translation may be different from the year of the international edition.
A control CV alone describes a portion of the observed variability. It does not automatically document all relevant contributions to the uncertainty of an outcome. The laboratory needs to explain the model, the sources included, possible correlations and the limitations of the data.
Numerical example of combining contributions
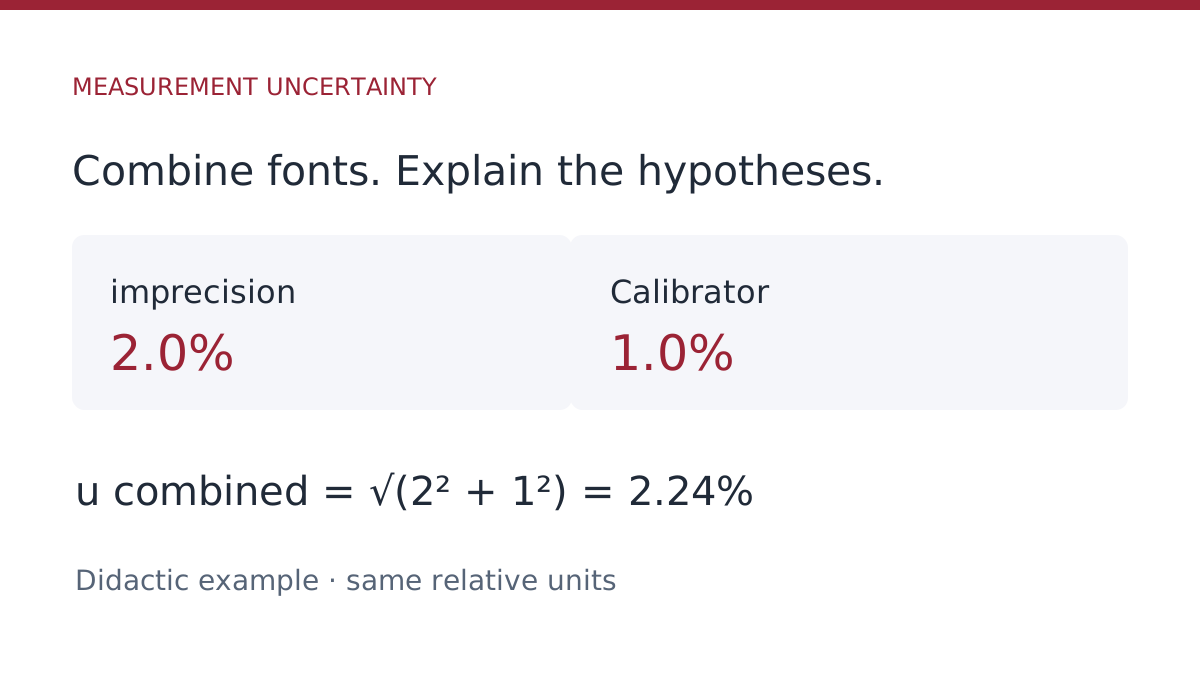
Assume, just to illustrate propagation, a relative imprecision contribution of 2.0% and a calibration-independent standard contribution of 1.0%. If both are expressed as standard uncertainties and there is no double counting, the quadratic combination will be: uc,rel = √(2.0² + 1.0²) ≈ 2.24%.
Adopting coverage factor k = 2 in this example, Urelay ≈ 4.47%. For a hypothetical result of 100 units, this corresponds to an expanded uncertainty of approximately 4.5 units. The coverage factor needs to be justified; k = 2 does not produce the same probability of coverage across any distribution or sample size.
If the calibrator certificate states an expanded uncertainty, convert it to standard uncertainty using the stated factor before combining. If the precision study already includes part of the calibration variation, adding the same contribution again overestimates the combination.
Script for documenting the calculation
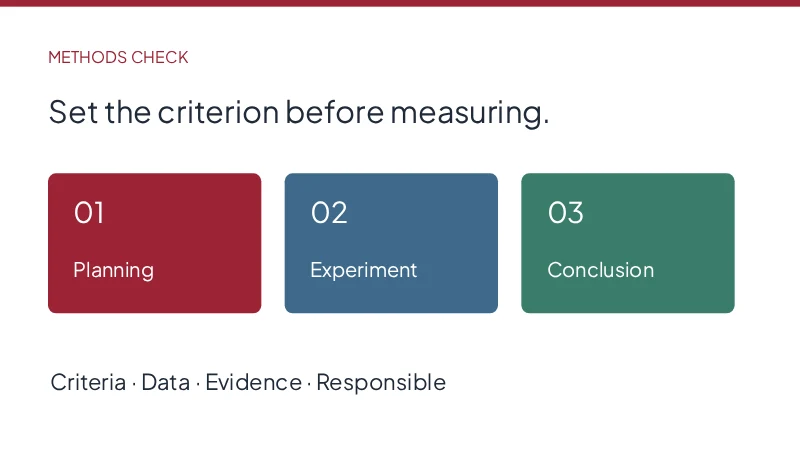
- Define the measurand, matrix and concentration range.
- Describe which performance data represents typical laboratory conditions.
- List contributions and record unit, distribution, coverage factor and origin.
- Evaluate dependence between components and possible contributions already included in the data.
- Present the combination, the rounding rule, and the conditions under which the result applies.
- Review the model after relevant changes and document technical approval.
An estimate should not be copied from another method just because it refers to the same analyte. Compare the conditions with your method verification and keep imprecision data traceable. To organize evidence in the system, learn about QualiChart resources.