QualiChart

Internal quality control software for the clinical laboratory.

Organize runs, track analytical performance and document decisions. QualiChart connects statistical monitoring to your team's routine.

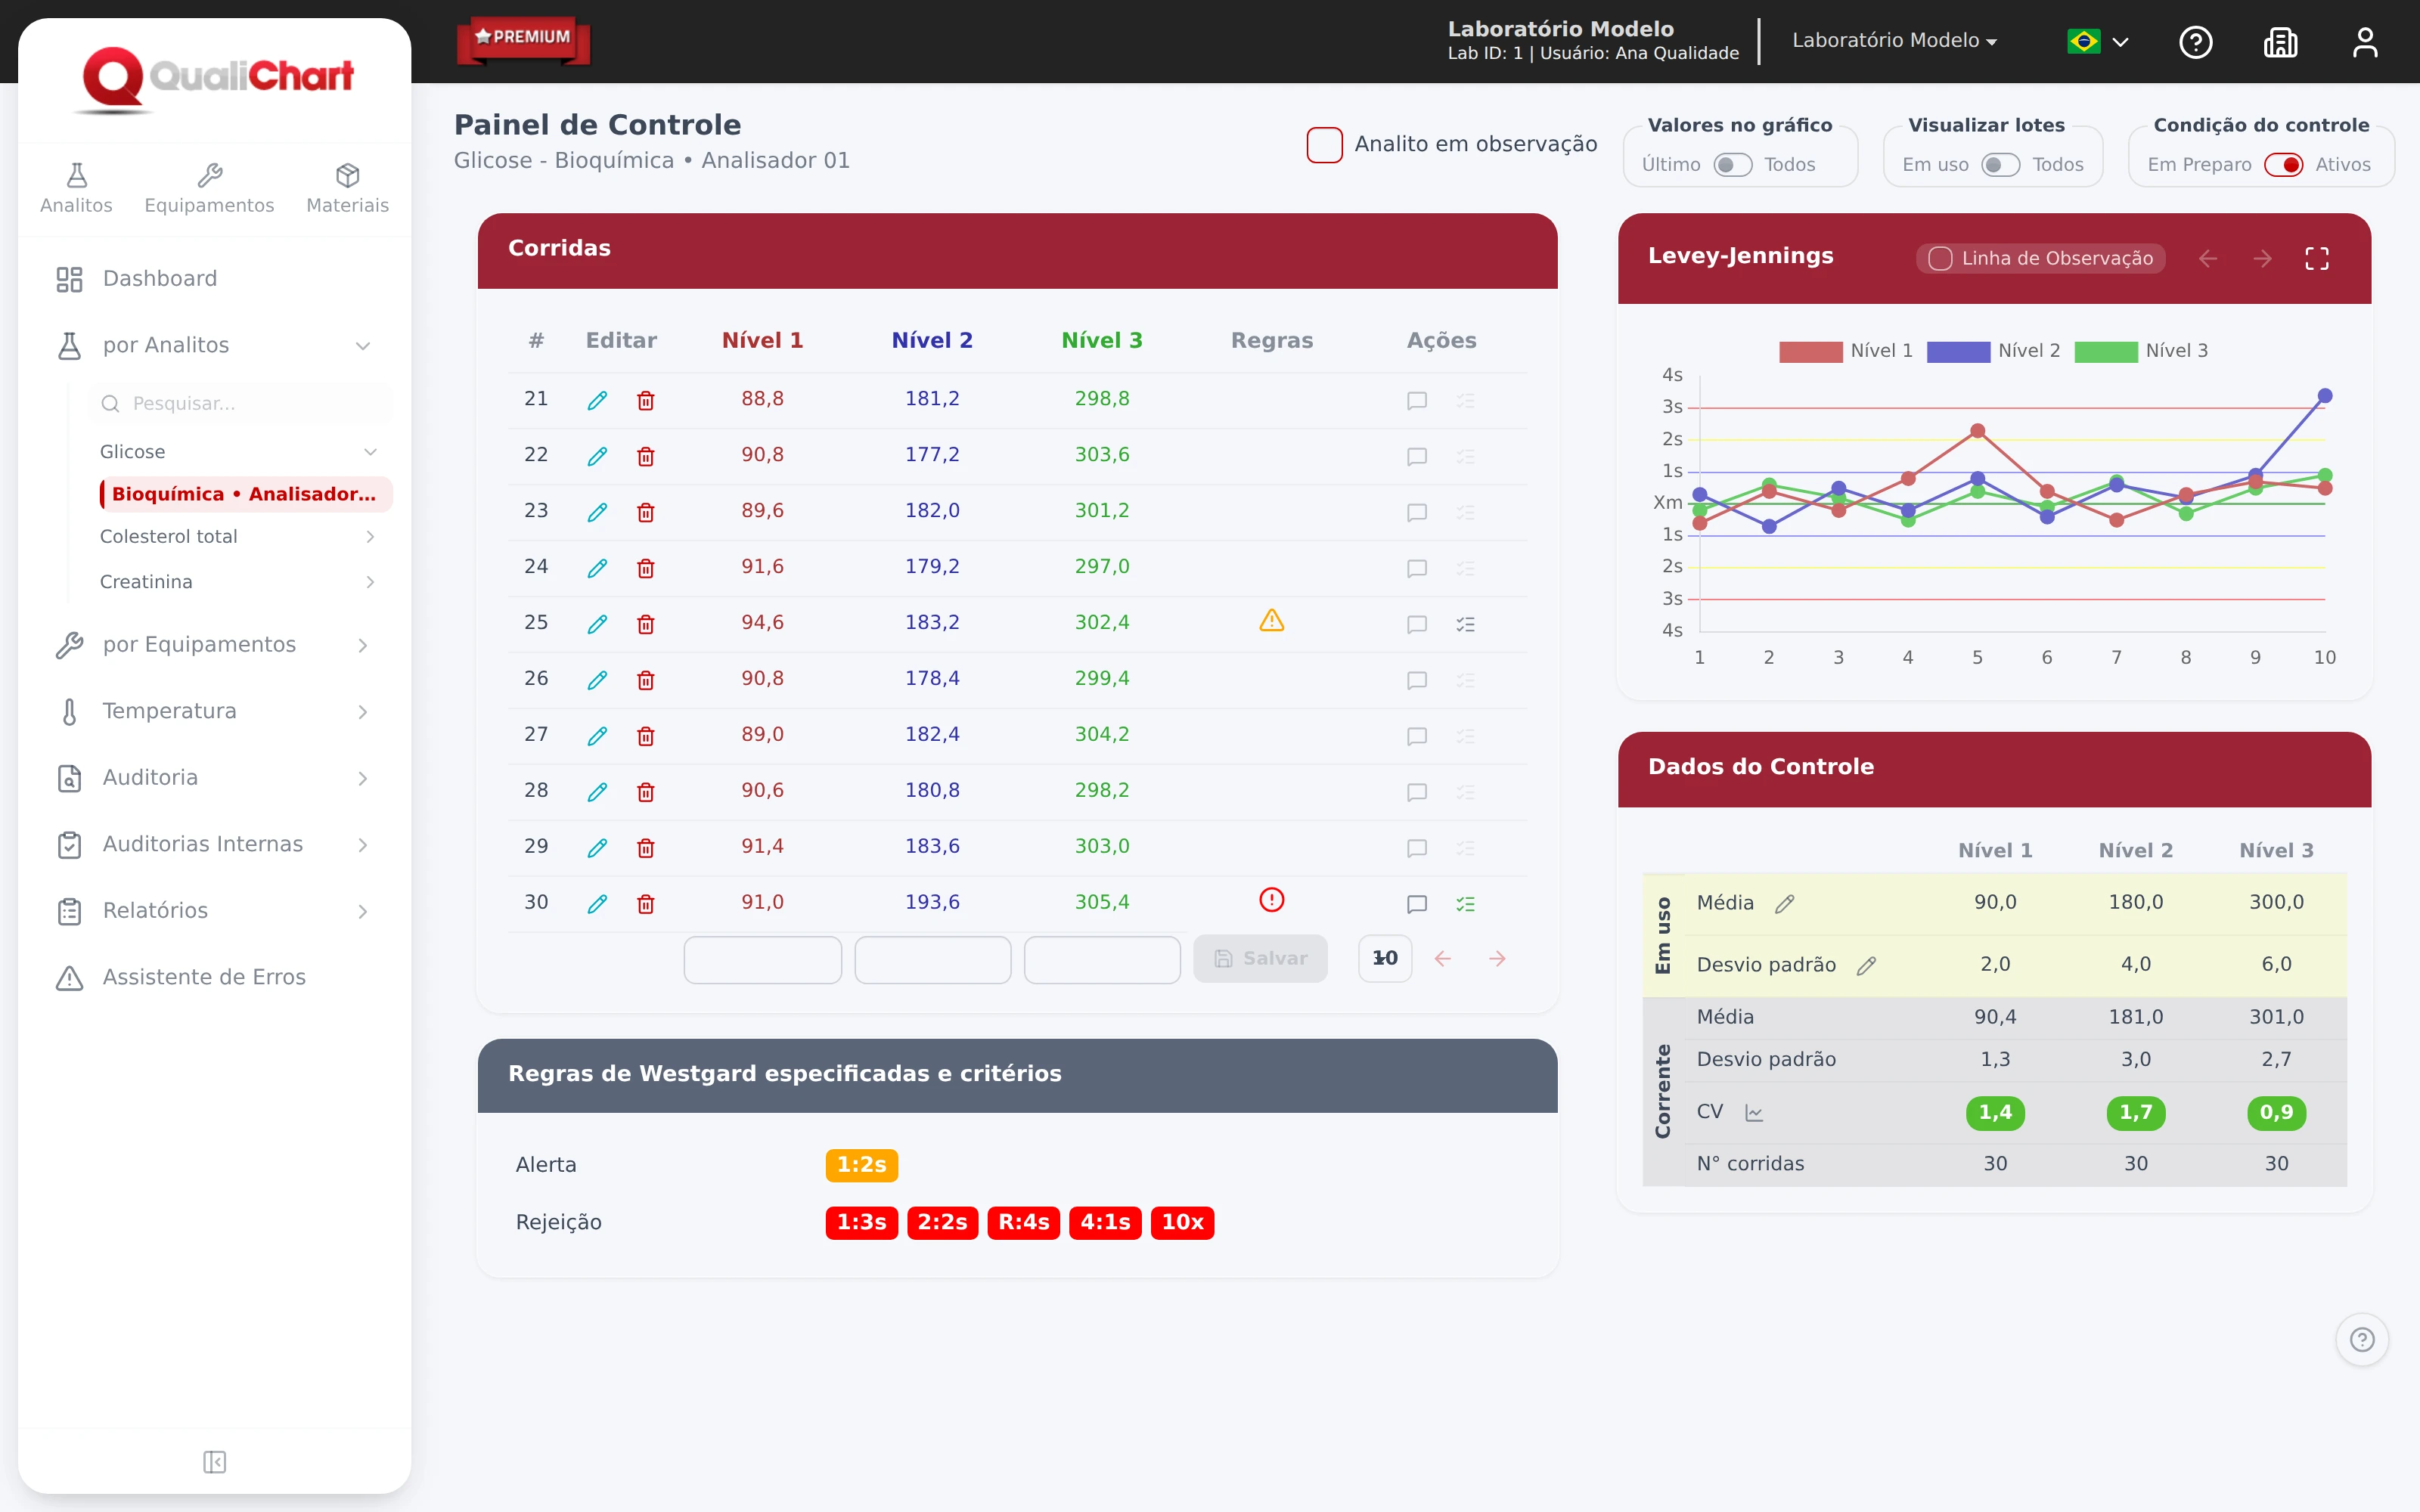
Your quality control, in one view.3 levels · active control
QualiChart: active control with three levels, a populated Levey-Jennings chart and a 1:3s violation Enlarge screen
Actual product screen · demonstration data · interface in Portuguese · Cropped view; enlarge to see the full screen.

The IQC in practice

From alert to investigation.

Scroll to explore

Three steps to follow the decision.

Continue page

01 / Active control

Deviation appears. You know where to look.

Compare three levels on the Levey-Jennings graph and see Westgard rule violations along with runs.

In this example: level 2 above +3 SD, with violation of the 1:3s rule.

Try for 30 days
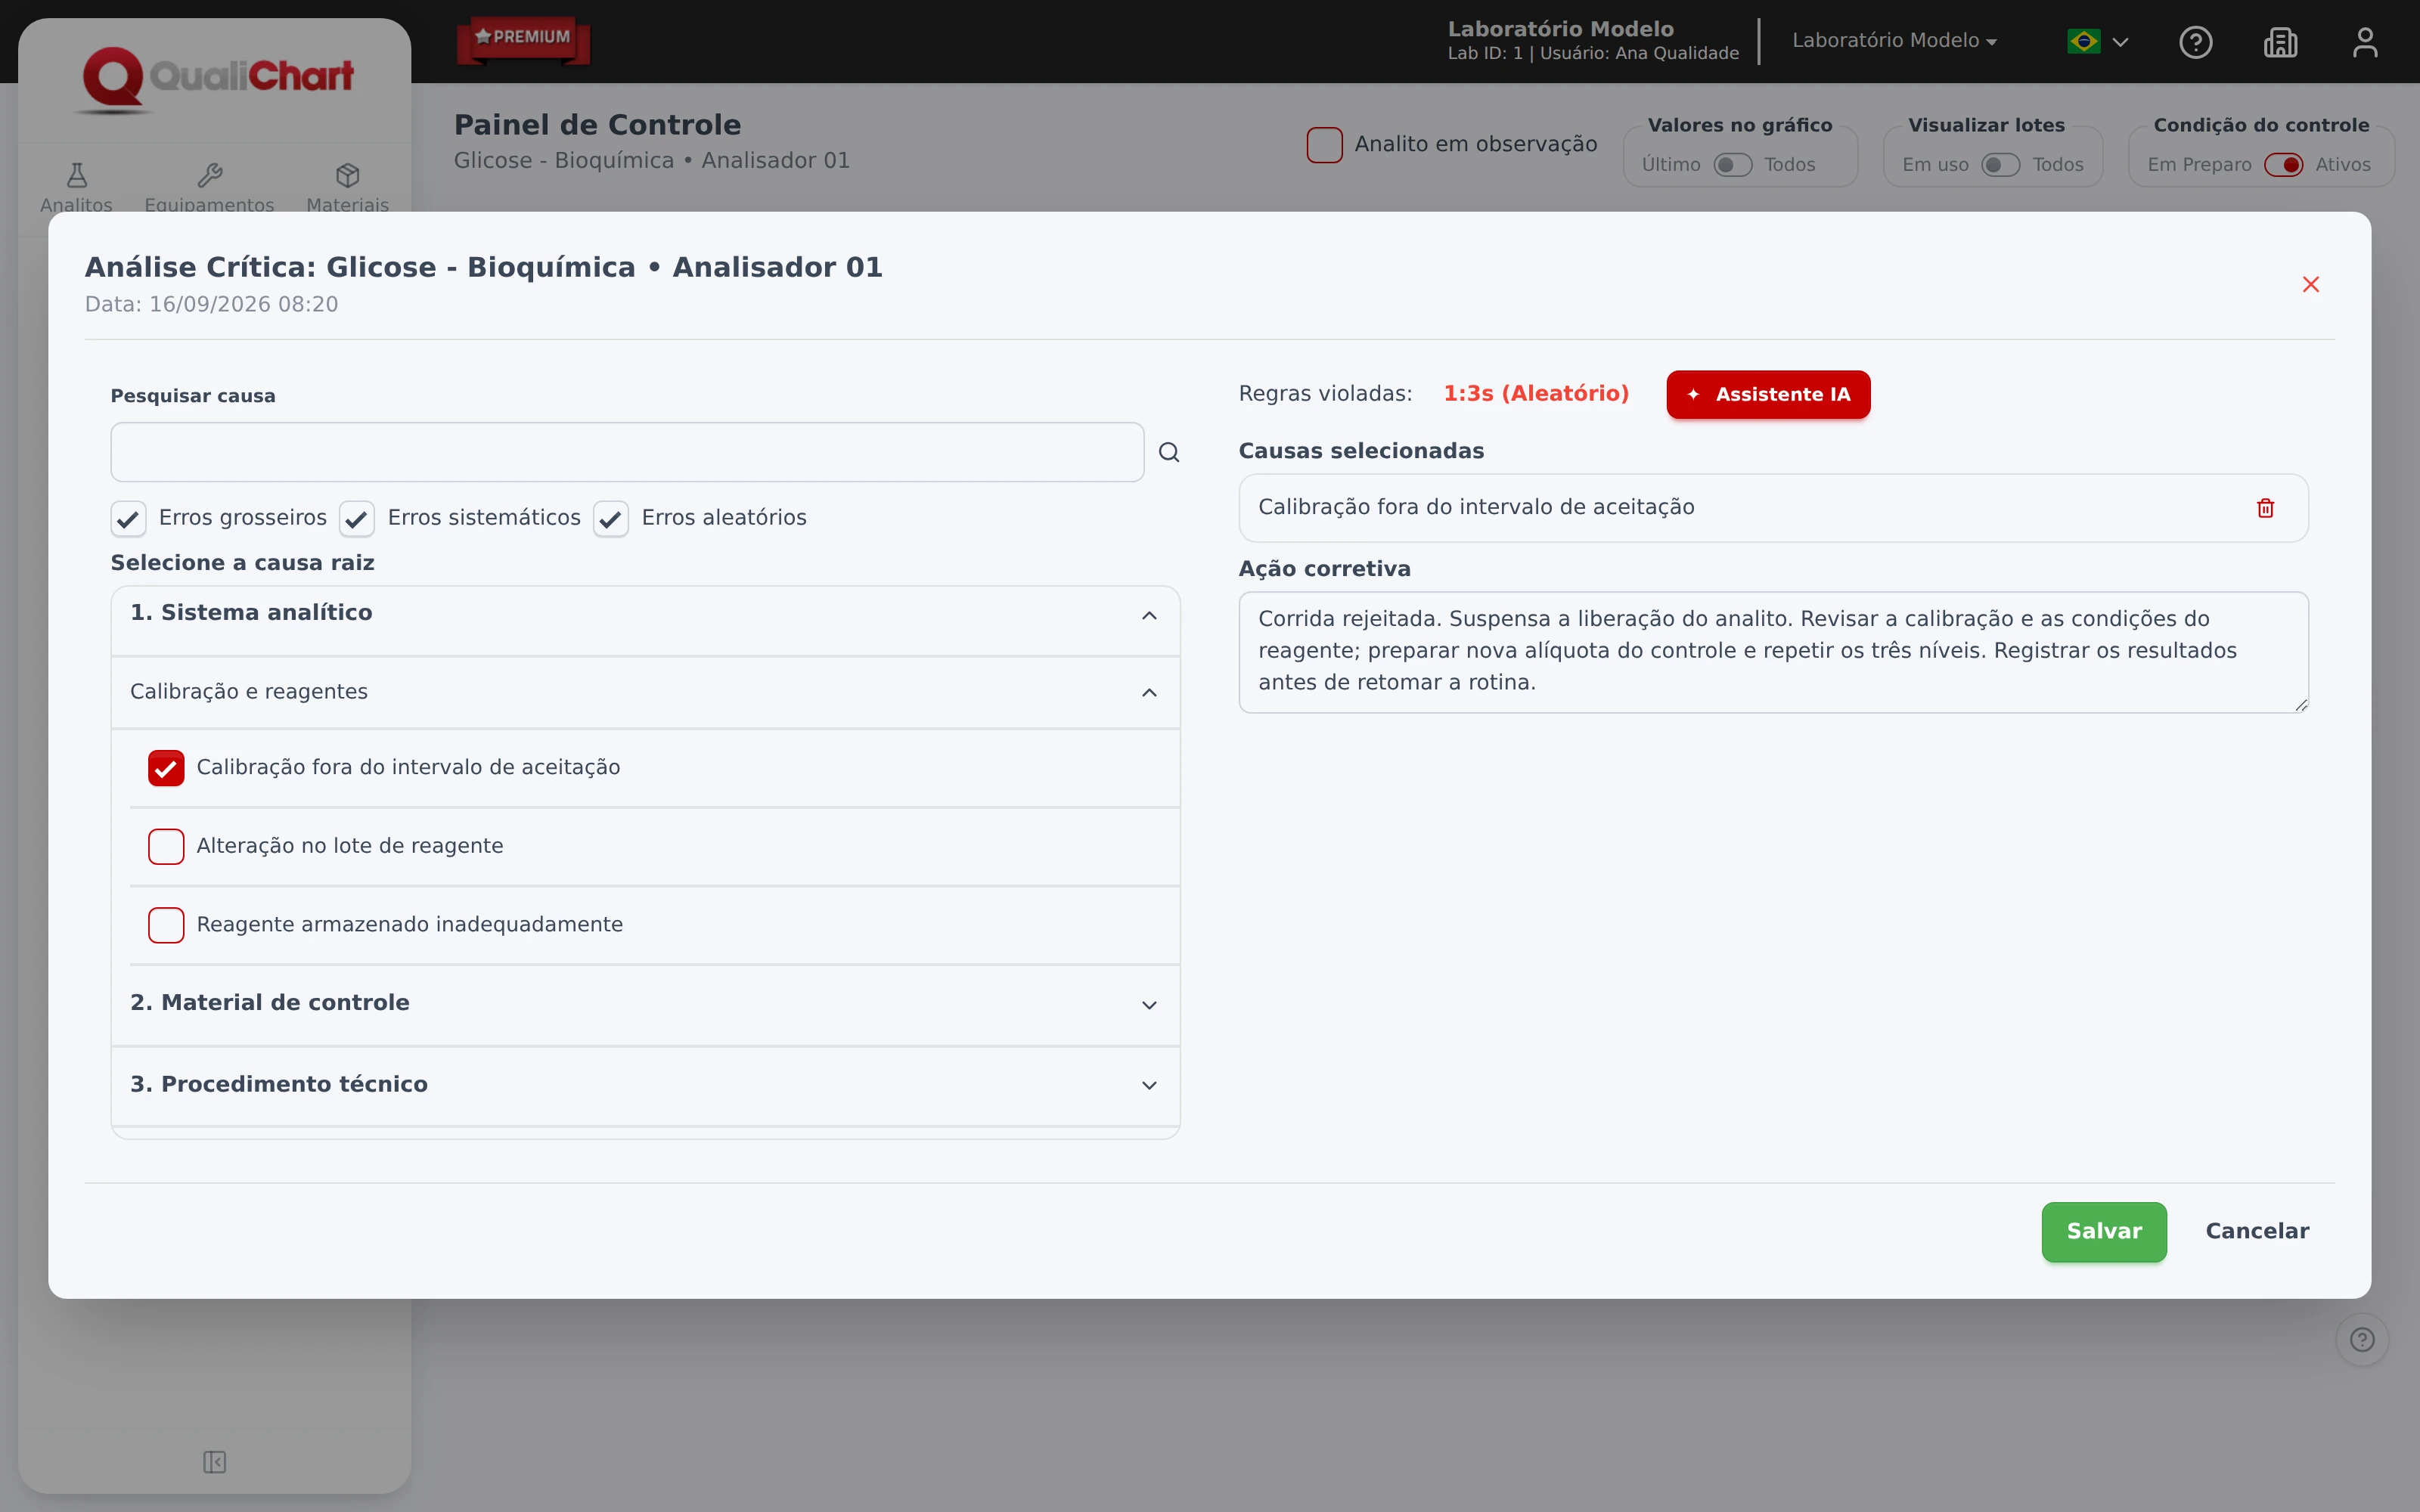
Active glucose control with three levels, filled graph, 1:2s alert and 1:3s rejection
Active control · 30 runs in history · demonstration data · Cropped view; enlarge to see the full screen.

02 / Critical review

From violated rule to documented action.

Investigate nonconformity, select causes and record corrective action in run context.

Rule, cause, action and date gathered to accompany the decision.

Try for 30 days
Critical run analysis with 1:3s rule, cause selected and corrective action filled in
Completed critical analysis · demonstrative data · Cropped view; enlarge to see the full screen.

03 / AI Assistant

More context to investigate the issue.

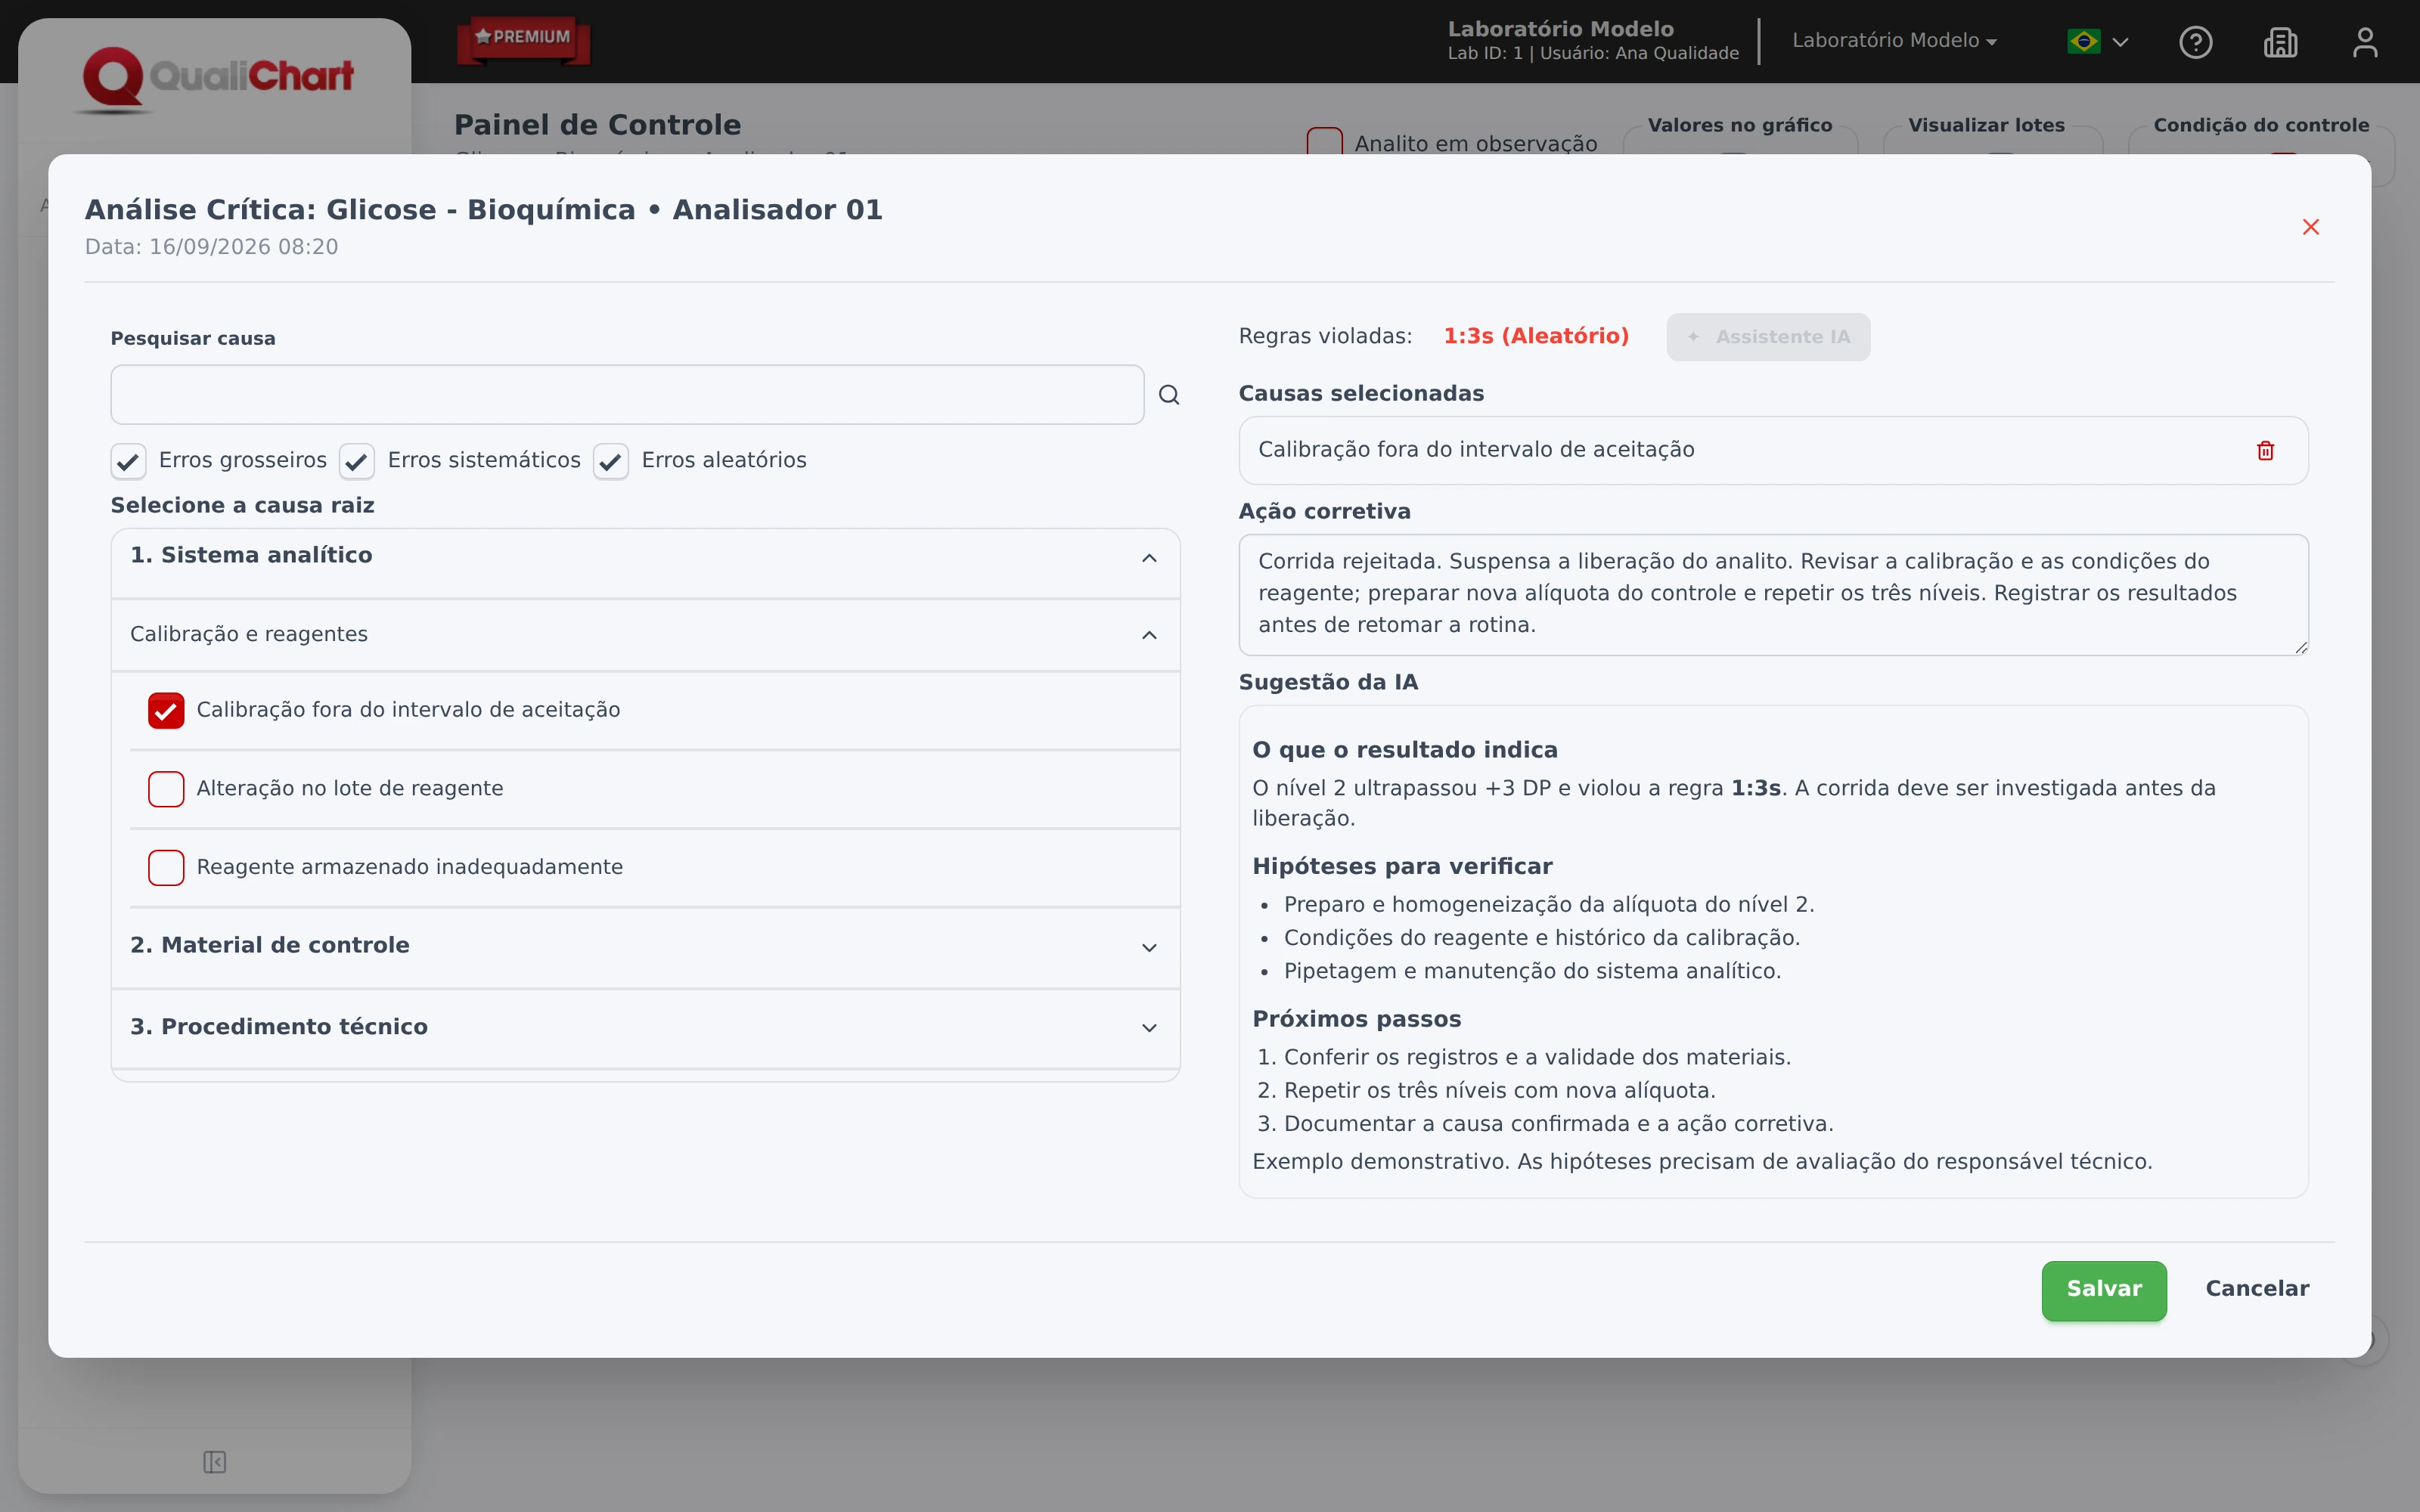
Consult suggestions for causes and next steps following a run with a broken rule, within the critical analysis itself.

AI supports research. The assessment and decision rest with your team.

Try for 30 days
AI assistant in critical analysis with interpretation of the violation, hypothesis of causes and next steps
AI assistant · illustrative answer with demonstrative data · Cropped view; enlarge to see the full screen.

Beyond control runs

Quality goes through the entire routine.

From preserving materials to reviewing processes: see other areas that your team can monitor on QualiChart.

Temperature control

Caution continues outside the analyzer.

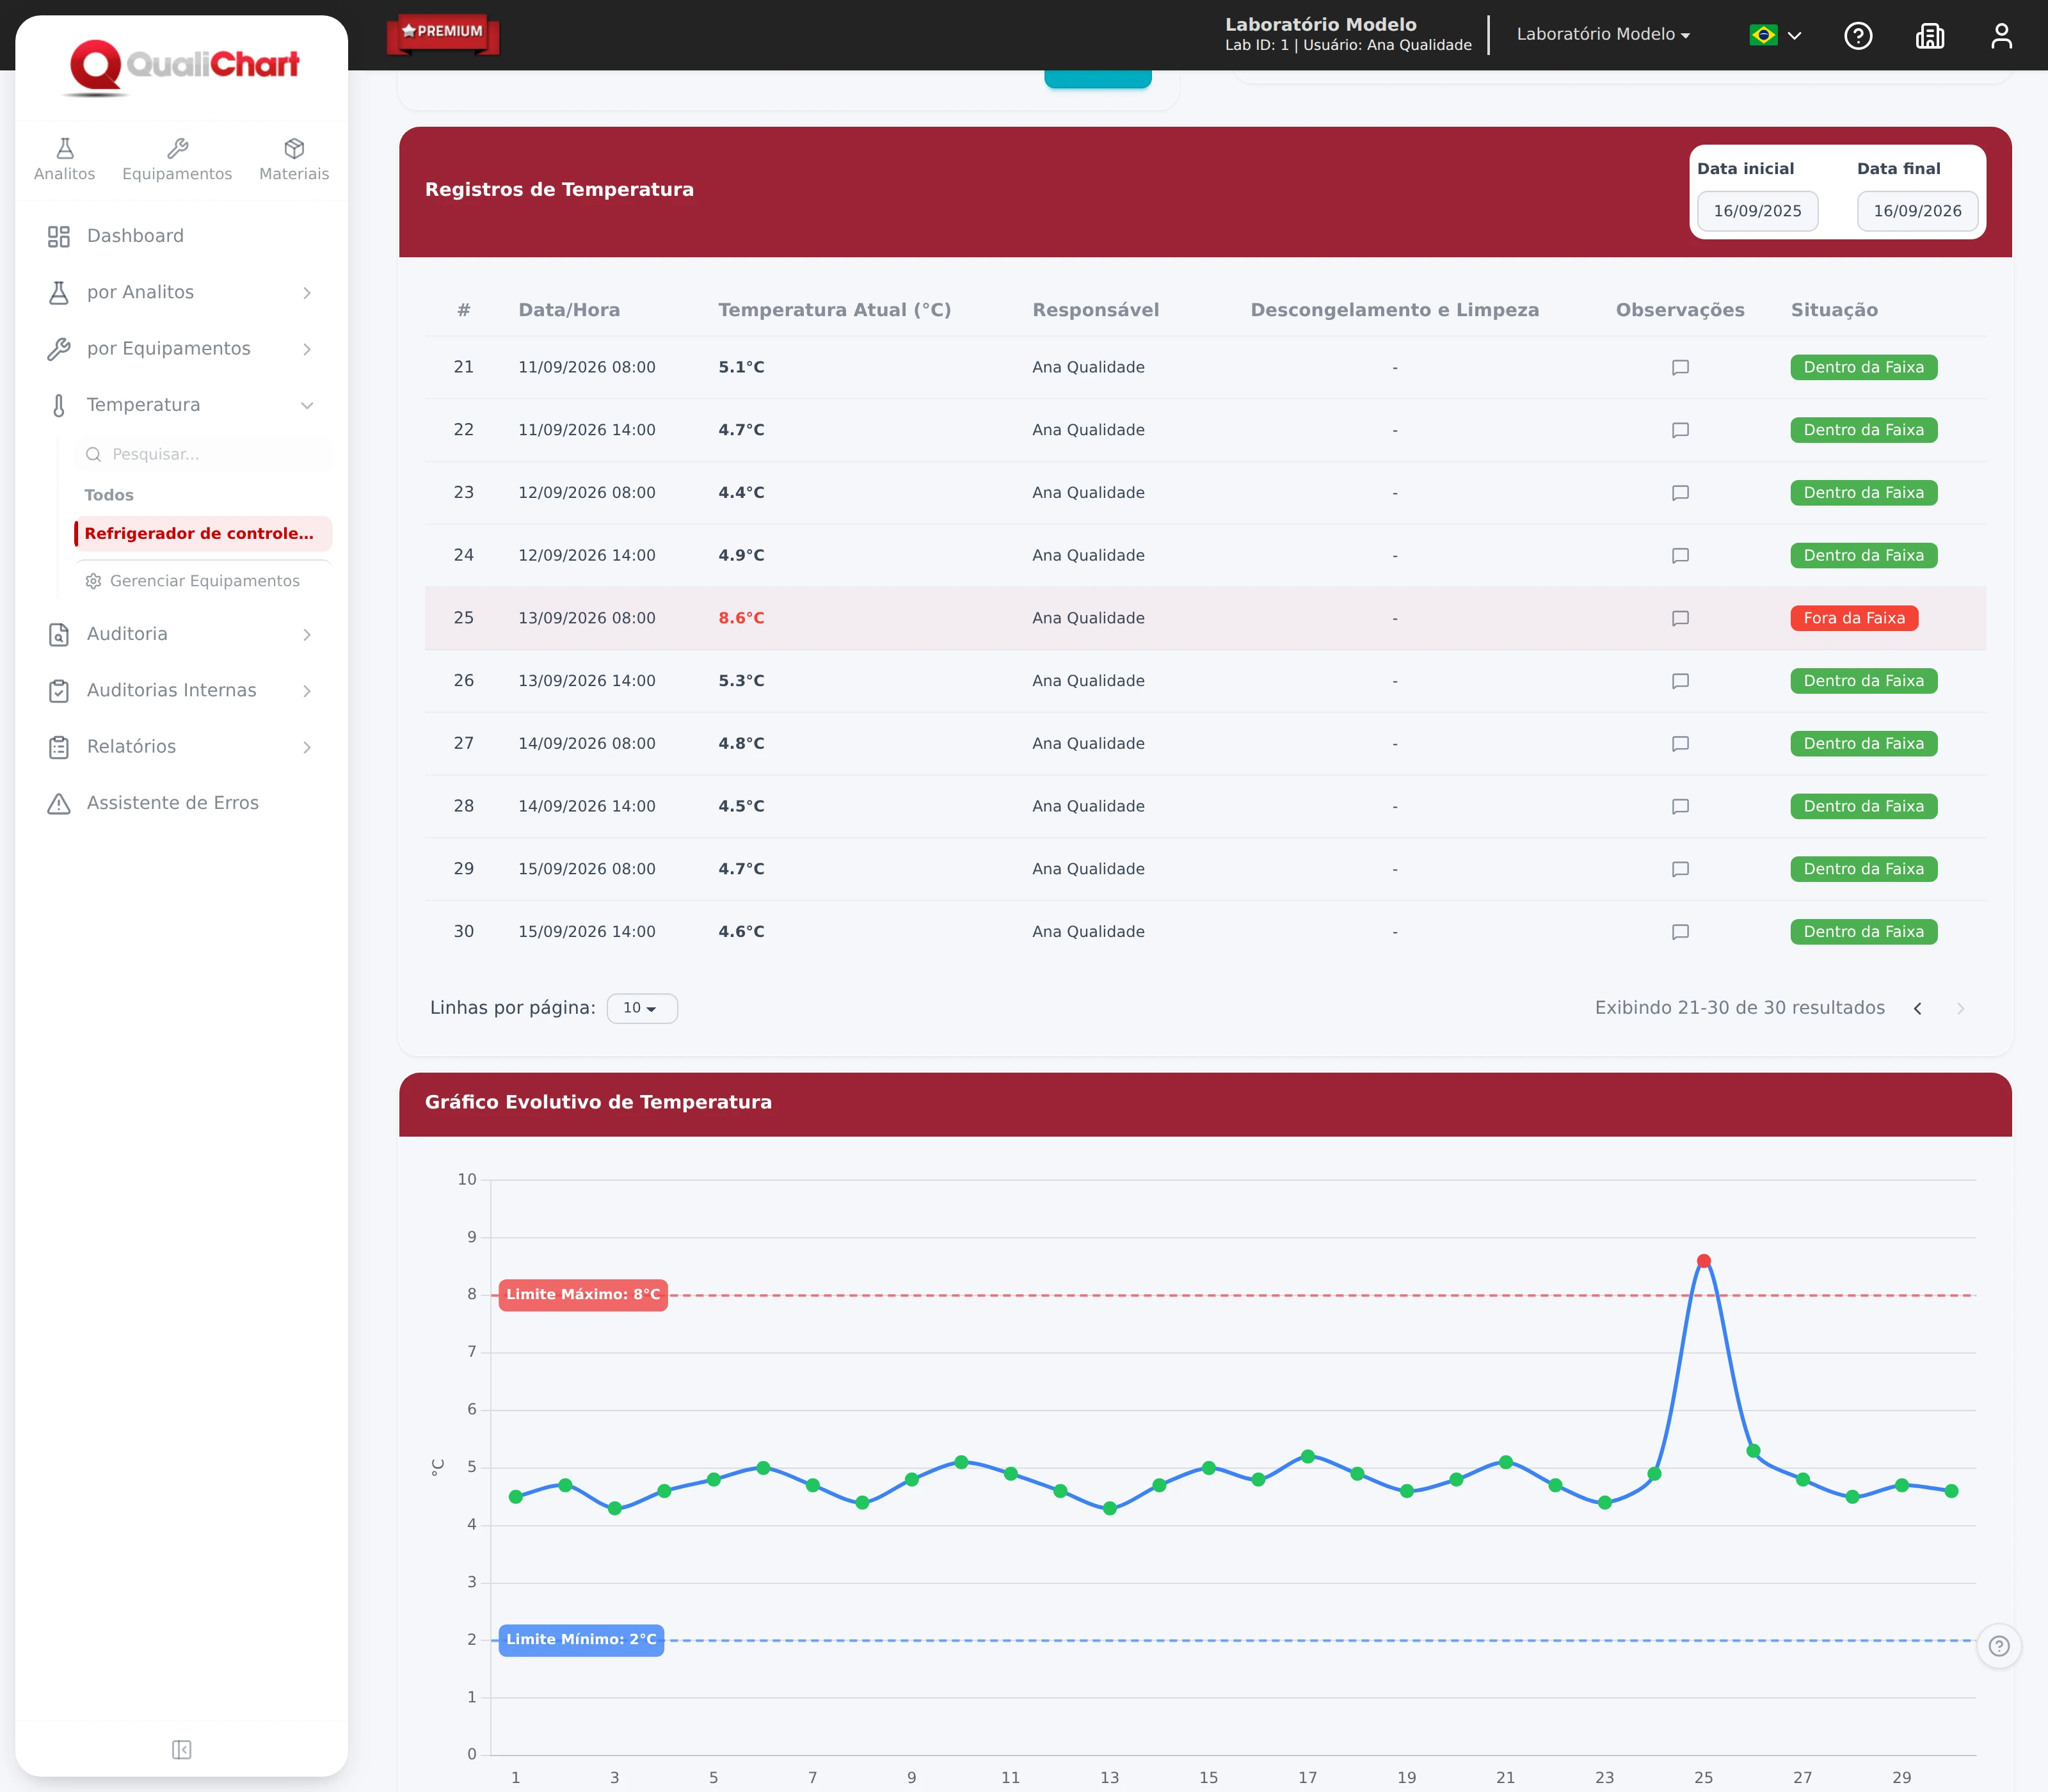
Track refrigerators and other equipment with defined limits, measurement history and records of who took each reading.

  • Graph with limits and out-of-range readings
  • Observations for recording occurrences and interventions
  • History by equipment, period and responsible
View in a demo
History and graph of the RF-01 refrigerator with limits of 2 to 8 degrees, an excursion and later readings within the range
RF-01 Refrigerator · temperature history and excursion · demonstration data

Internal audit

See what's covered. And what needs action.

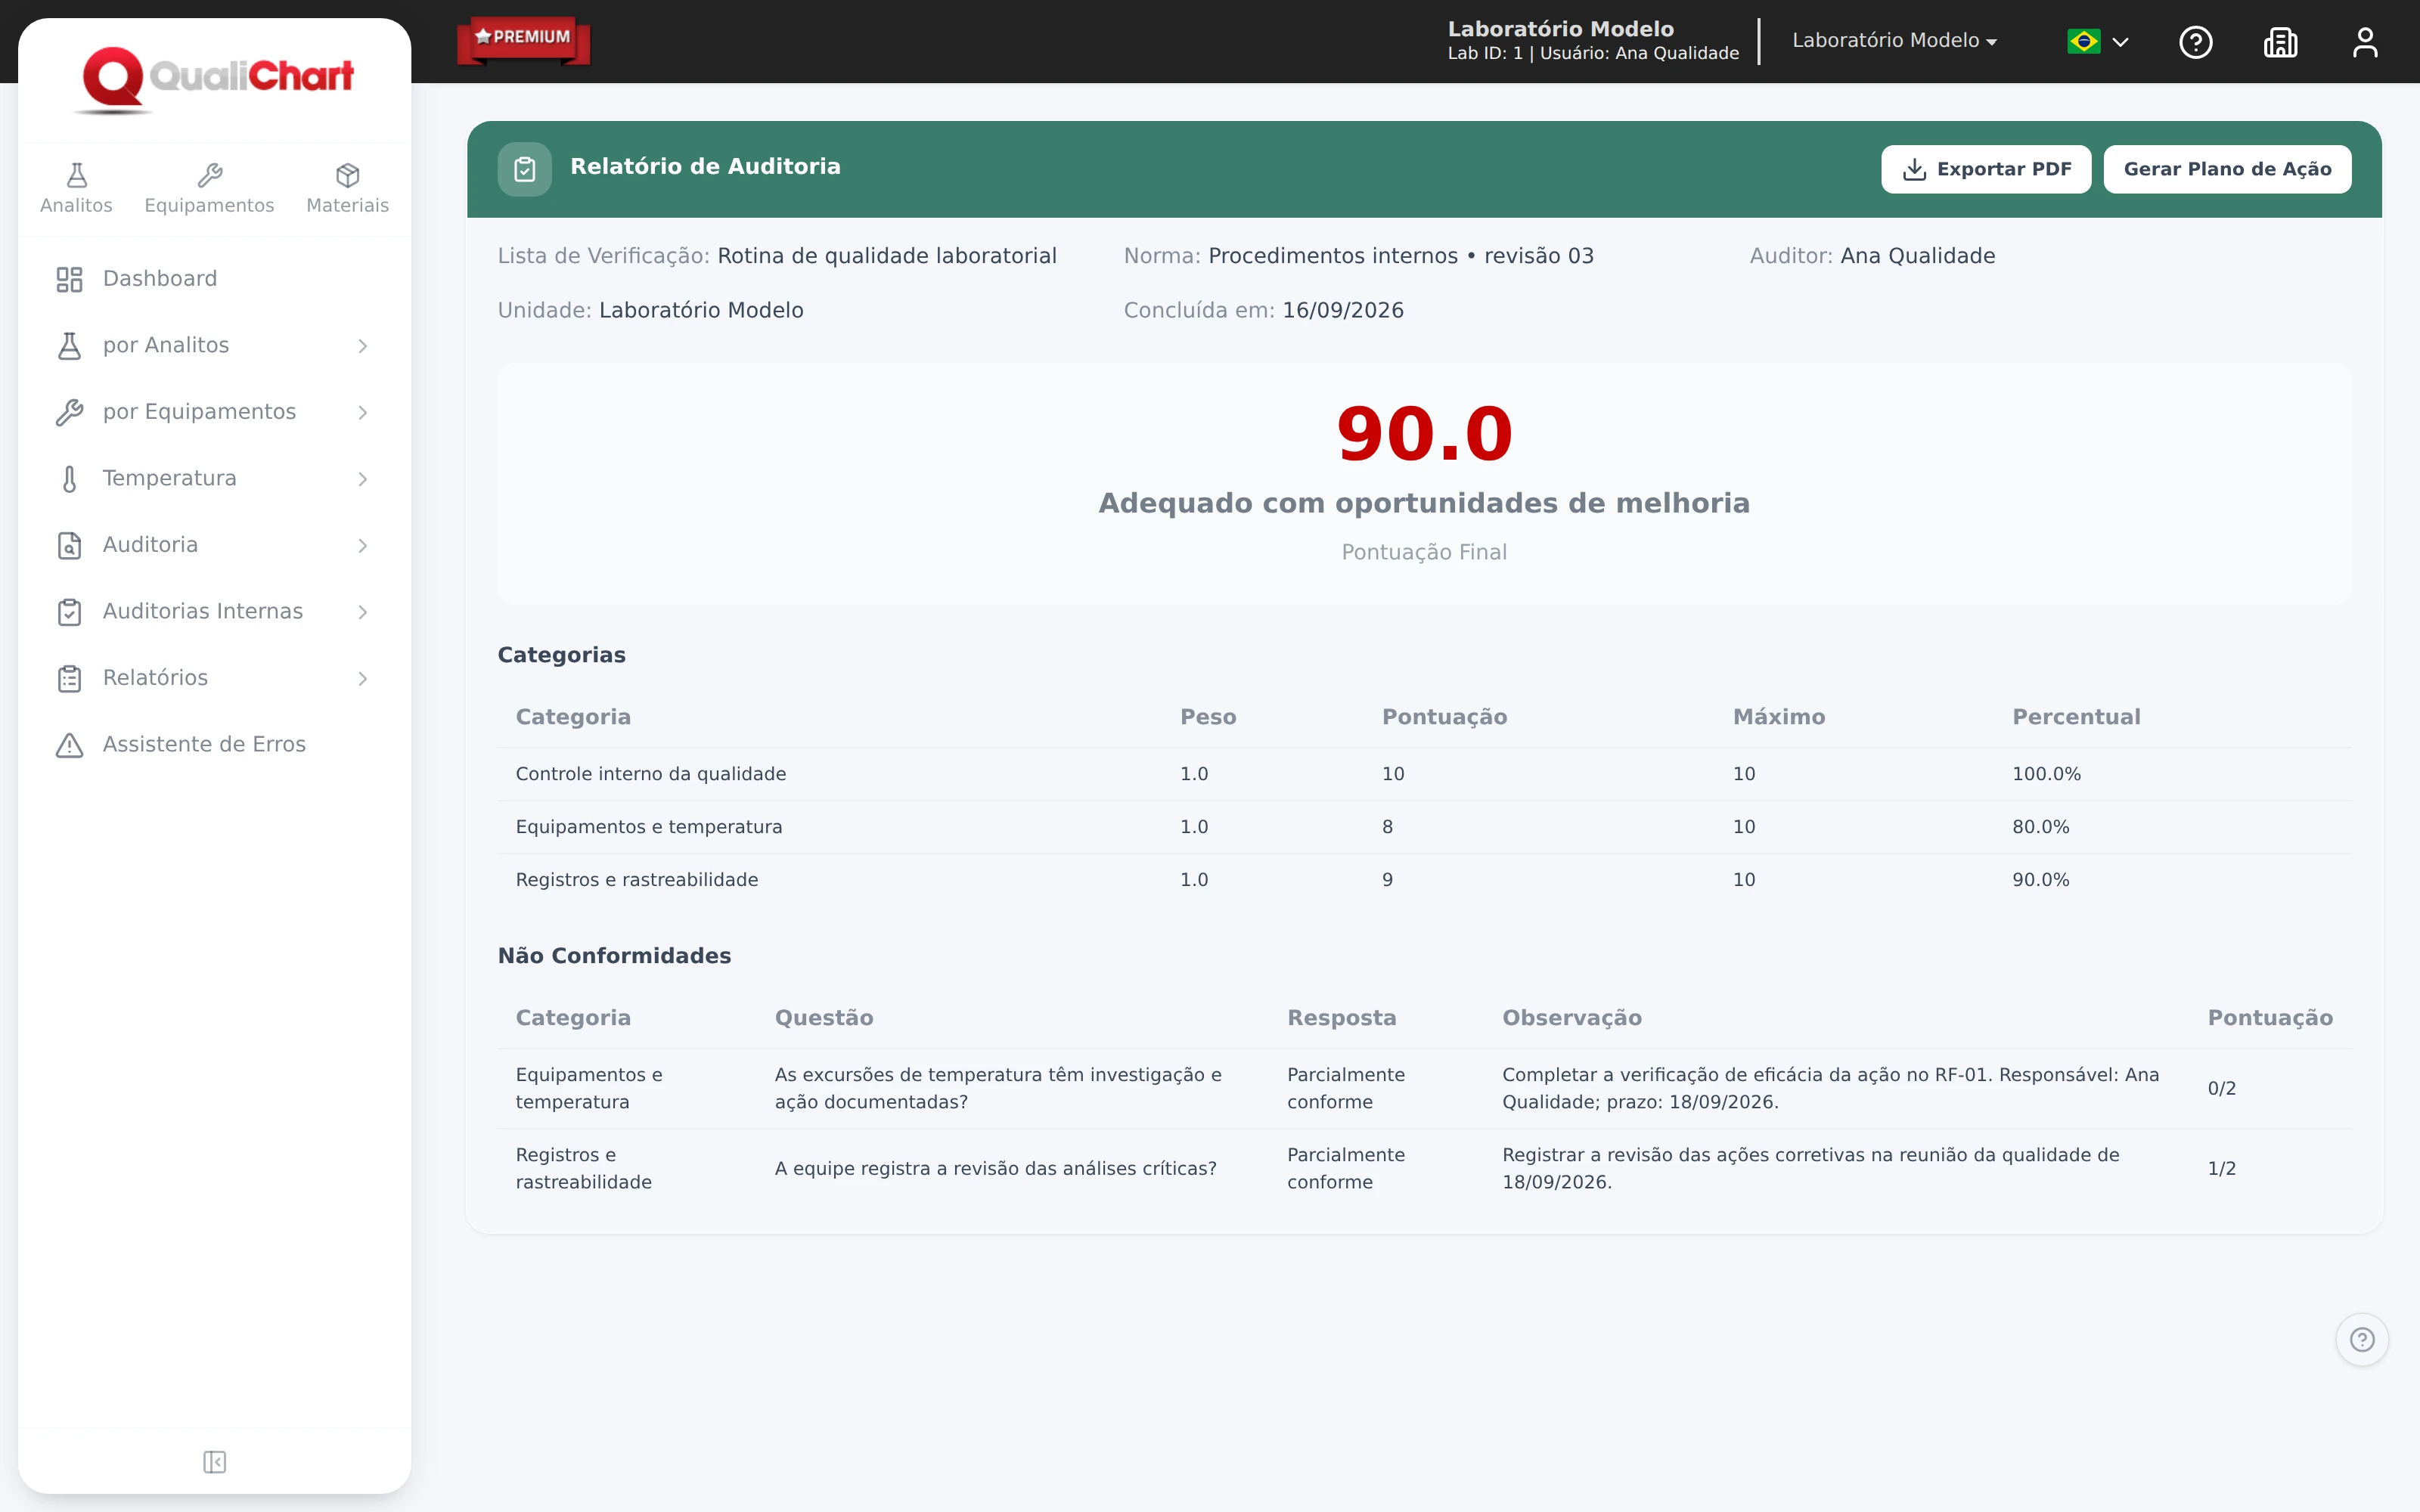
Evaluate the routine with checklists, gather evidence and track nonconformities in a report by category.

  • Results and scores by category
  • Non-conformities with audit observations
  • Action plan and PDF report export
View in a demo
Completed internal audit report, with results by category and two documented nonconformities
Audit completed · results and nonconformities · demonstrative data

Explore QualiChart with your team.

Create your account and start your 30-day trial.

Start a 30-day free trial

Complete control, from registration to reporting.

Register analytes, equipment and control materials. Register or import runs, view alerts and monitor the evolution of the coefficient of variation.

See this flow in a demo
  1. Organize Control

    Structure equipment, materials, batches and levels used in routine.

  2. Monitor performance

    Levey-Jennings, mean, standard deviation, CV and Westgard rules support the evaluation of runs.

  3. Record critical analysis

    Document the investigation, identified causes, and corrective actions for later reference.

Choose accompaniment level

Premium

Monitoring after implementation for your team to gain autonomy in the tool.

Premium Details

PLUS

Scientific consultancy to support error investigation and performance interpretation.

PLUS Details

Edu

IQC resources for teachers and educational institutions.

Edu Details

Records for quality management.

Results, observations, and corrective actions help organize IQC documentary evidence. Consult the requirements of RDC 978/2025 and its changes with the technical responsible.

Evaluate the routine with the RDC 978 diagnosis

View a deployment experience.

Discover the report from Laboratório Paulo C. Azevedo on the use of QualiChart.

Read Lab Case

Let's clarify

Before choosing your IQC system.

See plans and conditions →
How much does it cost?

The price depends on the number of units and equipment, in addition to the plan and monitoring chosen. Therefore, prices are upon request. Request a proposal with the scope of your laboratory.

How does deployment work?

In the demonstration, we show the routine and data that you already use. The team combines the setup and training outlined in the plan. The schedule depends on this survey.

Can I exit the spreadsheet?

The system offers import of runs via CSV file. The team guides the format and evaluates the data available for the transition.

Compare with Spreadsheets Does
Integrate with my LIS or equipment?

Enter the manufacturer, model and export format. Compatibility needs to be assessed for your environment prior to hiring.

Understand integration
How is data processed?

Access to the system is via user account and HTTPS connection. The Privacy Policy describes data processing and the channels for exercising your rights under the LGPD. Ask the team for the data storage, backup, access and processing conditions applicable to your contract.

Security and privacy
Can I test before hiring?

Yes. You can create an account and evaluate the system for 30 days free of charge. You can also request a guided demonstration. The commercial proposal informs users, equipment, validity, billing and cancellation rules before contracting.

Start my 30-day trial

QualiChart in its structure

User experience

The IQC seen by those who take care of the routine.

“The system gave us an overview of control in all laboratory units, which makes it possible for us to anticipate problems through real-time data analysis.”
Silvana Pires · Technical responsible for the Paulo C. Azevedo Laboratory report
Read the full case and its context

Records for quality

From IQC requirement to the evidence of your routine.

RDC 978/2025 establishes requirements for services that perform clinical analysis tests. QualiChart helps organize control results, evaluation criteria and investigation records for review by the technician responsible.

Track performance

Gather runs, graphs, average, standard deviation and CV by control, level and equipment.

Record decisions

Document the critical analysis, the hypotheses investigated and the actions in the face of results outside the criteria.

Retrieve evidence

Consult the history to prepare technical discussion, audits and process evaluation.

The system supports documentation; compliance depends on the execution of laboratory processes. Diagnose your IQC routine.

Does your team use spreadsheets today?

Fewer files to check. More context to decide.

Compare how investigation results, formulas, permissions, and records are maintained in a spreadsheet and a dedicated system.

  • Graphs and calculations along with control data
  • Investigation and actions on run history
  • Shared routine with per-user access
Compare QualiChart with Excel →

Your next step in quality control

Put QualiChart to the test. Free for 30 days.

Create your account and evaluate QualiChart in your laboratory. Do you prefer a guided introduction? Request a demo with our team.