About the author

Silvio de Almeida Basques
Author of materials on internal quality control and information systems for laboratories.
Training and experience
Doctor, with residency and postgraduate degree from the Federal University of Minas Gerais and specialist title from the Brazilian Society of Clinical Pathology. Retired professor at the UFMG Faculty of Medicine.
Introduction
Is it appropriate to rely on the range provided by the control material manufacturer to control the stability of your analytical system?
It is a fact that many laboratories in our country declare that they use the range provided in the control materials package insert to assess the control status of their analytical environments.
Manufacturers provide marked values worldwide to be used as a reference.
However, it has long been known how restricted and inadequate a simple practice such as judging by range alone can be, when the purpose is to be effective in controlling analytical imprecision. Less, is often less.
How does the practice take place?
Laboratory professionals in our country declare that they use Excel® spreadsheets as a method of controlling their analytical systems.
Many laboratories use spreadsheets for Internal Quality Control (IQC) and reporting, but the inadequacies of using spreadsheets for IQC are substantial. There is little discussion on this subject and the professional community continues to have beliefs about this application. Some adapted the Microsoft Excel® program, since IQC is a Statistical Process Control, hence the immediate idea of using the statistical functions already built into this program to apply to IQC.
Searching for scientific publications on PubMed that supported the use of spreadsheets in IQC, we found very old citations (1986, 1994) that do not clearly mention this application for quantitative control.
We still do not know the positions of accreditation bodies, or Health Surveillance inspectors on the extent to which laboratories that use this method meet the requirements.
This eBook opens the discussion on the use of spreadsheets as a way to perform IQC. Seeks to highlight and discuss topics that highlight how spreadsheets can be inadequate and provides recommendations for implementing a dedicated and effective control method.
Why was this practice established?
The immediate availability of the manufacturer's values makes it easier to start the routine. This does not eliminate the need to evaluate the adequacy of the limits for method performance in the laboratory itself.
The width of the suggested range
It is understandable that laboratory professionals seek to use computer methods to solve their need to perform IQC on a daily basis, avoiding the enormous amount of work involved in statistical calculations. Having a way of dealing with this demand for calculations and keeping good records in a practical way is undoubtedly valuable, hence the idea of trying to use spreadsheets. However, this adaptation is only partial and it has long been known how restricted and inadequate this practice can be, when the purpose is to be effective in controlling analytical imprecision. Less, is often less.
To better explain our thinking, we will make an analogy regarding the use of the spreadsheet tool for IQC and the use of common tools in everyday life — pliers and hammer.
Imagine that you want to see a beautiful painting hanging on a wall and you want to use the pliers tool to fix a nail that will support that painting. It may even work to try to nail with pliers, but it is not the best tool and using it can cause problems, such as a hurt finger and a bent and unstable nail. This is also how IQC is done with the Excel® tool — daily analysis of the material and efforts to enter run results into the spreadsheet.
Our understanding is that its use is not worthwhile and the practice does not last a month, a consequence of the confusion generated by the attempt to use it for all quantitative tests.
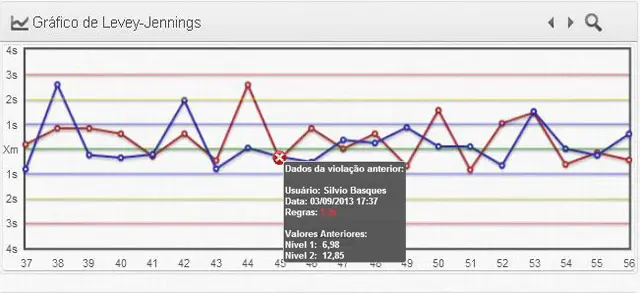
Through my searches on the internet, it was not possible to find an Excel® spreadsheet that does the IQC well. The one I found for this purpose does not have minimal resources: it does not have the possibility of dealing with more than one level of control, it does not have a Levey-Jennings chart with line color patterns, it does not test Westgard's multiple rules and it does not issue automatic alerts — and the professional will not be able to deal with the countless quantitative tests, with records and reports. Anyway, it's good quality pliers, but still pliers.
If you already spend resources on control material and have the trouble of carrying out the analyses, why not complete it with specialist calculation tools for IQC that will actually help you control your systems? Why not use Westgard's rules for better results from your control method? If you adopt well-recommended specialist programs (the right tool), you will be able to count on the participation of your bench assistants, to whom you will delegate functions at the IQC. Your Internal Control will be much more effective.
Do I have good control if I follow the manufacturer's stated limits?
You do have some control, but far from good control. You spend time and money on the materials you consume, but you do not obtain the desired effects for your Internal Quality Control. If you just compare your results with the range, you are missing important evaluations, because you no longer have the necessary parameters for judgment, you no longer have the graph.
Because it uses a wide range, it may sometimes have lost calibration, or had another problem that increases its variability and thus unduly accepts results for controls that could compromise patient results, notably at borderline values. You don't realize it's poor quality.
Levey-Jennings Plot
The figure on the side reinforces this argument, in that the limits established by the interval show a standard deviation offered by the package insert, around 5 times greater than that of the laboratory itself (SD of use, obtained from the package insert and used as a graph limit; current SD, calculated with data from runs in the laboratory).
This is why the curves in the graph are close to horizontal, when they should show oscillations around the average, in the following distribution:
- 68.26% of the time will be in the range of +- 1 SD
- 95.46% of the time between +- 2 SD
- 99.73% of the time between +- 3 SD

How does IQC fall short if the manufacturer's stated range is used?
Let's go to the origins: IQC is implemented to detect possible problems. It does not create quality, but rather points out when it has been lost.
Therefore, IQC must be vigilant, a sentinel capable of identifying problems when they occur and not warning if there is total compliance.
To do this, he must have a refined, critical, trained and well-configured "eye" to fulfill his role, which is achieved with a computer program dedicated to IQC. A low-vision sentinel will only be able to point out a problem when it is very large and, perhaps, late.
If IQC is well configured, the contribution to laboratory quality will be even greater.
Therefore, it is more effective to do good control, not just any control.
The IQC must be vigilant, a sentinel capable of identifying problems when they occur and not warning if there is total compliance.
The results of the control runs that were plotted on the graph could be seen differently if they were also plotted on the Gaussian curve.
Visual analysis shows a small variation in the amplitude of the points, but it does not reflect the expected behavior of the curve, with the variability indicated above, for occurrences between 1, 2 and 3DP.
The question to be asked is whether variations greater than those plotted would be noticed, that is, whether stability losses due to random errors would be identified.
A series of results from the control material that show this behavior is not bad, but it can be seen that the system is not configured properly, because it has very broad limits.
Case Study
An analyst had an experience with Amylase and shared his problem with the scientific consultant, which we report below.
The run data for two controls were obtained in a real environment of a medium-sized laboratory, over 21 days and plotted in sequence to establish the laboratory's own baseline, that is, the preparation phase. The analyst was able to obtain two important pieces of information from the beginning until the eighth analytical run:
Two Main Findings:
1. That the average values were below that indicated by the supplier of the control material, since the results oscillated below the Xm line (green line), around 1 standard deviation.
2. That the oscillation was of small amplitudeindicating a CV smaller than that calculated by the manufacturer's values, which was good.
As the objective was to establish the laboratory's own mean and standard deviation parameters, these values were initially considered acceptable.
Applied Methodology:
- Calculation of Mean, Standard Deviation and Coefficient of Variation;
- Evaluation of the Levey-Jennings graph, with the finding of trends and others;
- Comparative analysis of its imprecision, measured by the Coefficient of Variation;
- IQC multiple rules tests, the Westgard Rules;
- Daily recording and assessments, as data is not noted down effectively;
- Recording significant information about important occurrences in the systems and finding the root cause;
- Internal Quality Control Reports.
Could the manufacturers have done things differently?
The practice of using manufacturer’s stated range for IQC presents significant limitations for detecting problems in the analytical system. A more appropriate approach would be to develop control charts based on the laboratory's own data.
The important thing to highlight is that none of this would be possible if IQC was carried out only by comparing the results of the manufacturer's stated range.
Spreadsheets are excellent calculation tools, but they are not suitable for IQC because they do not provide the necessary results, such as those provided by dedicated programs.
In summary
Performing Internal Quality Control by evaluating the result in comparison with the range provided by the control material manufacturer is a method, but it is not a good control and is not enough.
The manufacturer-assigned values are only useful at a stage in which the laboratory's own data is verified.
We believe that manufacturers will sooner or later adopt a different and improved suggestion for their control material consumers. Evolution is necessary.
Observations and declaration of interest
1. I am directly involved with a program dedicated to Internal Quality Control, QualiChart, because I created it in the late 1990s and I am a scientific consultant.
2. My opinions on manufacturers's logic are the result of market analysis;
3. I do not have any direct relationship with manufacturers of control materials, nor do I recommend or criticize any of them or their commercial strategies.
Published August 2013
Conclusion and Additional Resources
The vast majority of laboratory professionals in Brazil understand the importance of carrying out internal quality control, for the benefit of patients. To do this, they acquire control materials, analyze them and seek to interpret their results.
The problem lies in the method they use to make comparisons and draw conclusions about the control state.
One estimate is that there are more than 10,000 clinical laboratories that do not perform good control.
In the next articles in this series we will discuss other methods also used. We will cover the use of spreadsheets, equipment data and computer programs dedicated to IQC.
Automatically generate Levey-Jennings Chart with QualiChart
QualiChart offers a complete solution for Internal Quality Control, with automatic generation of Levey-Jennings charts and data analysis.
Get started now with the free plan at www.qualichart.com.br
Did you like it? Share this content
Published December 2013