The Levey-Jennings Chart is a control chart in which the results of the analytical run are plotted as a function of time, or number of runs. It is an important ally of the laboratory professional, in internal quality control, to highlight the status of the analytical system and help ensure the reliability of the results delivered.
The chart represents the fourth step of the "Internal Quality Control (IQC) Journey", a system comprised of nine steps to ensure that analytical processes function correctly and results are delivered safely.
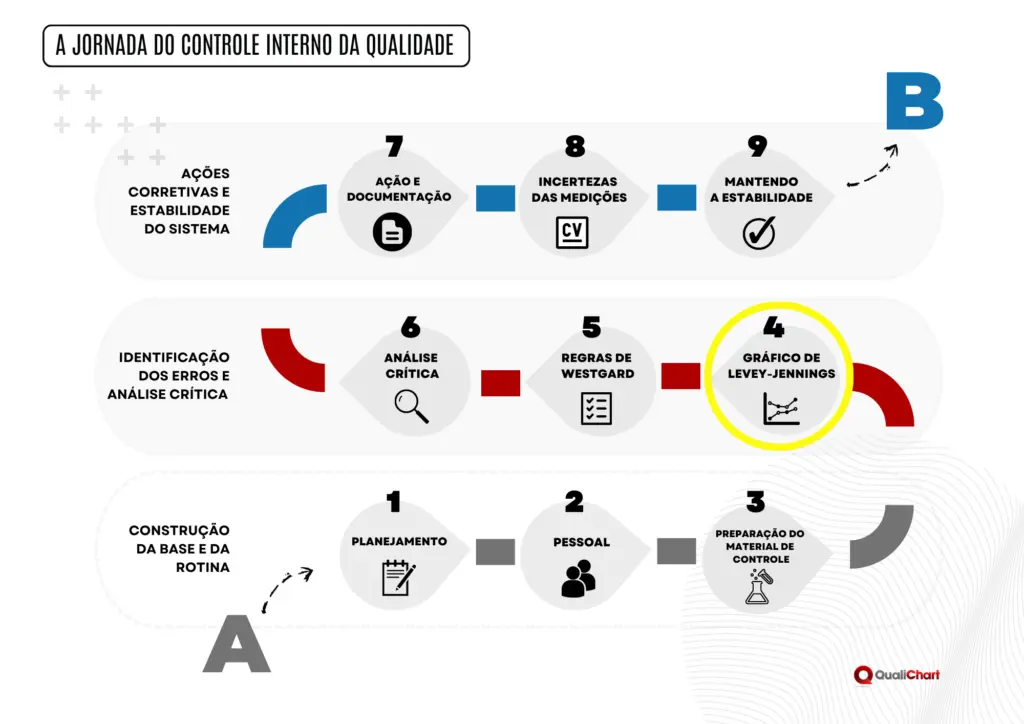
The IQC journey is an online guide that clearly and simply shows the steps necessary to face the challenges of internal quality control, such as validating control daily, performing critical analyzes correctly, applying multiple rules and managing the team and staff turnover.
If you don't already know the steps, you can access our guide by clicking here and have access to all the information necessary to follow the IQC journey successfully.
How did the Levey-Jennings graph come about?
Levey & Jennings introduced this application in 1950, based on a control chart used in industry since 1931, when it was created by statistician Walter A. Shewhart, who created Statistical Process Control. Levey-Jennings' contribution, this important tool for the laboratory, was later improved by Henry and Segalove, who used the limits of ±3 standard deviations, based on analysis of long-term series.
Statistical Process Control is the basis for modern Internal Quality Control (IQC). The laboratory performs analysis on control materials and the results are released and plotted on the Levey-Jennings Chart.
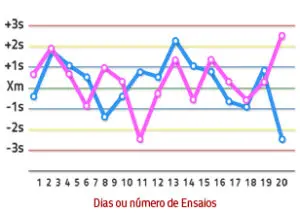
Professionals clinical laboratory will be able to identify whether the points are within the established control limits. The points joined by lines display the different expressions that are of interest to internal control, such as deviations, trends and randomness. One of the advantages of using the chart is that you obtain simple, reliable and effective information quickly.
How to interpret the Levey-Jennings graph?
During the internal quality control some error situations may occur. The analysis of the graph is very helpful in understanding the variability of the results obtained from the materials and can already indicate whether there is a random error or a systematic error, even in the preparation phase. At this stage, we seek to define the laboratory's own values, for mean and standard deviation. See some situations that the Levey-Jennings Chart indicates, with two graphic examples.
“Out of Control”: Once the limits have been established by the laboratory, results on the graph that are beyond these limits may represent an out-of-control situation. The criteria for treating these results must also be defined, whether they will be alert or rejection criteria;
Increased imprecision: It is displayed as an increase in randomness, in which even with results oscillating around the average, the points are very far from it. When greater than three SD, this distance already indicates the need to reject the analytical run;
Loss of accuracy: Accuracy can be evaluated and its loss noticed in a short time on the graph when the points leave the expected oscillation around the average and move upwards or downwards. Complementary analysis must be carried out with the results of external control;
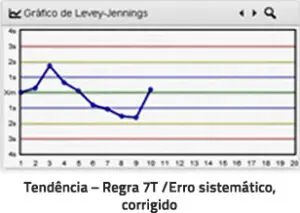
Trends: It is easily noticeable on the graph, when it points out systematic errors, which have the right direction, that is, more or less.
For the scientific consultant of QualiChart, Dr. Silvio Basques, the Levey-Jennings Chart is an essential tool in quantitative internal control. “The Chart provides a lot of information and has a great pedagogical effect, encouraging the sharing of information about control events with all employees”.
Ways to generate the Levey-Jennings Chart
O Levey-Jennings Plot can be generated in different ways, however, not all of them are practical and effective for a good internal quality control.
- Manually: the Levey-Jennings Chart is created on graph paper. The laboratory professional must prepare the x and y axis scales, in addition to marking the mean and control limit lines by Standard Deviation. In this way, with each new run, the value obtained on the bench is plotted on paper and the professional analyzes its position in relation to the limit lines and draws conclusions about the control state. You will need to have a graph for each analyte and for each month of work. It is not justified to make the IQC and the graph on paper, given the large amount of time and the low level of benefits it provides;
- Excel®: Using spreadsheets the laboratory professional must create tables and graphs in Excel® to obtain the desired information. Each analyte must have a different tab in the spreadsheet, for better visualization and understanding of the data. It is quite difficult to have in a spreadsheet plotting lines of various levels of control and testing theWestgard Rules. Spreadsheets are not practical for IQC and their contribution is insufficient;
- Computerized programs: These automatic programs offer laboratory professionals control at up to three levels, with the Levery-Jennings Chart in real time, alerts for violations of the Rules of Westgard and the calculation of the coefficient of variation, which is the best measure of analytical imprecision for each test. It also provides reports, an error assistant and a history of control non-conformities. You just need to enter the run data and the graph is automatically generated. Sometimes data is also inserted automatically, via interface. The programs are didactic and enable sharing and recording of occurrences for long-term analysis.
Internal Quality Control – How to carry out good control
Many practices for Internal Quality Control (IQC) have been in common use for many years. Professionals who adopted them continue to use them, despite the fact that some have been shown to be inappropriate. This is because there is an inertia to make changes, to face possible barriers, or a lack of knowledge of new and good practices. The challenge that arises is how to implement a good control method, applying the Levey-Jennings chart and using it well, correctly and productively, in other words, carrying out good control.
In contacts with professionals who registered to use the program QualiChart we saw the different forms previously adopted for the IQC, some subject to criticism:
I do IQC with Excel:
Electronic spreadsheets are good tools for calculations, statistics, etc. But they are generic. A specific spreadsheet for IQC, which makes it possible to carry out good control, at up to three levels, with Westgard rules, with Levey-Jennings graphs for dozens of analytes, reports, error assistants and other supporting information is a challenge and we have not yet found it.
Making an analogy, imagine that you want to see a beautiful picture hanging on a wall and you want to use the pliers tool to fix the nail. It may work, but it is not the best tool and its use can cause problems, such as a hurt finger and a bent, unstable nail. This is also how IQC is done with the Excel tool, a good quality pair of pliers, but still pliers. Through internet searches, it was not possible to find an Excel spreadsheet that does the IQC well. The one we found for this purpose does not test Westgard's multiple rules, it does not justify the expense of materials, daily analysis of the material and the efforts to use it. It's not worth it and the practice doesn't last a month, a consequence of the confusion generated by the attempt to use it for all quantitative tests.
If you already spend resources on the control material and have the trouble of carrying out the analyses, why not complete it with specialist calculation tools for IQC that will actually help you control your systems? Why not use the Westgard rules for better control results? If you adopt well-suited specialist programs (the right tool), you will be able to count on the participation of your bench assistants, to whom you will delegate functions at the IQC, as per item 1, above. Your Internal Control will be much more effective.
The same reasoning also applies to those who perform the IQC, comparing the result with a range provided by the manufacturer. This is not good control. The range provided by the manufacturer should not be used for IQC limits, except for an initial period, which we call the preparation phase, according to Dr. Westgard. What can we say about the impossibility of using multiple rules, calculating the Coefficient of Variation and producing reports? If you already do the main thing, which is the analytical run of the material, you have already spent on it, complete with data analysis using the appropriate tool.
I make my graphics on the equipment itself:
This is a subject that provokes several discussions, since there is a lot of equipment with different control software. I present some questions that represent the practice of good control and that we usually ask the professionals we talk to. Try to answer with YES, or NO:
- Does the equipment allow you to use the package insert data at one stage and then start using your own values for limits on the Levey-Jennings graph?
- Does the equipment software exclude runs out of control (outliers) from the series when calculating current values?
- Do you receive comparisons with CV values and maximum imprecision, to evaluate your own imprecision?
- Can you record occurrences and interventions in the system, relating to analytical runs?
- Do you have sequential assessments for systematic error detection (10x rule) for consecutive days?
- Can you specify different sets of rules for different analytes on the same instrument?
- Can you look at the analyte history and check previous outlier runs and what corrective measures were taken?
- If the laboratory has manual techniques for quantitative tests, can you handle IQC data from these tests in a practical and correct way?
- Can you issue IQC reports for long periods of time to demonstrate to the Health Surveillance?
- Can you access data from all your equipment (Biochemistry, Hematology, Hormones, Blood Gas Analysis, Immunology) from different locations, from your room, or even from another building, from another technical area?
If you answered NO to three or more of these questions, you will certainly benefit from adopting a specialist program for IQC. Otherwise, you won't be doing good control.
Conclusion
The control chart is a valuable instrument in IQC. To use it, the professional must look for practical and feasible ways, with clear results that can be shared by everyone involved with the analytical steps. Try, you and your team, to do good control, using the chart.
Calculation tools help organize control and its records. Evaluate how fits into the process defined by the team and the current requirements applicable to the IQC . The tool does not guarantee compliance by itself.