About the author

Silvio de Almeida Basques
Author of materials on internal quality control and information systems for laboratories.
Training and experience
Doctor, with residency and postgraduate degree from the Federal University of Minas Gerais and specialist title from the Brazilian Society of Clinical Pathology. Retired professor at the UFMG Faculty of Medicine.
Introduction
Spreadsheets
Spreadsheets are computer programs that present the user with different tables, which can contain information, formulas, various calculations and complex mathematical functions.
Spreadsheets have become common applications used in today's business for everything — such as simple calculations, databases and various improvised forms. They use them to track a wide range of information, from employee hours at companies, household expense reports, sophisticated engineering projects, financial calculations, etc.
The history of the use of spreadsheets is long in the brief history of computing, with some names of programs that became famous, such as Visicalc (the first known, created by Dan Bricklin and Bob Frankston), Lotus 123 and the most recent, Microsoft Excel®, which surpassed all the previous ones.
Because spreadsheets are clearly useful in business, given their popularity and versatility of use, they are often applied to tasks for which they are poorly adapted — tasks that would be handled more appropriately in database systems, which are also computer systems with a lot of capacity and robustness.
With any software tool, the risk is to believe that spreadsheets are a panacea for all problems.

Is using a spreadsheet in IQC an adaptation?
Laboratory professionals in our country declare that they use Excel® spreadsheets as a method of controlling their analytical systems.
Many laboratories use spreadsheets for Internal Quality Control (IQC) and reporting, but the inadequacies of using spreadsheets for IQC are substantial. There is little discussion on this subject and the professional community continues to have beliefs about this application. Some adapted the Microsoft Excel® program, since IQC is a Statistical Process Control, hence the immediate idea of using the statistical functions already built into this program to apply to IQC.
Searching for scientific publications on PubMed that supported the use of spreadsheets in IQC, we found very old citations (1986, 1994) that do not clearly mention this application for quantitative control.
We still do not know the positions of accreditation bodies, or Health Surveillance inspectors on the extent to which laboratories that use this method meet the requirements.
This eBook opens the discussion on the use of spreadsheets as a way to perform IQC. Seeks to highlight and discuss topics that highlight how spreadsheets can be inadequate and provides recommendations for implementing a dedicated and effective control method.
Spreadsheet in IQC is a "Brazilian way"?
It is understandable that laboratory professionals seek to use computer methods to solve their need to perform IQC on a daily basis, avoiding the enormous amount of work involved in statistical calculations. Having a way of dealing with this demand for calculations and keeping good records in a practical way is undoubtedly valuable, hence the idea of trying to use spreadsheets. However, this adaptation is only partial and it has long been known how restricted and inadequate this practice can be, when the purpose is to be effective in controlling analytical imprecision. Less, is often less.
To better explain our thinking, we will make an analogy regarding the use of the spreadsheet tool for IQC and the use of common tools in everyday life — pliers and hammer.
Imagine that you want to see a beautiful painting hanging on a wall and you want to use the pliers tool to fix a nail that will support that painting. It may even work to try to nail with pliers, but it is not the best tool and using it can cause problems, such as a hurt finger and a bent and unstable nail. This is also how IQC is done with the Excel® tool — daily analysis of the material and efforts to enter run results into the spreadsheet.
Our understanding is that its use is not worthwhile and the practice does not last a month, a consequence of the confusion generated by the attempt to use it for all quantitative tests.
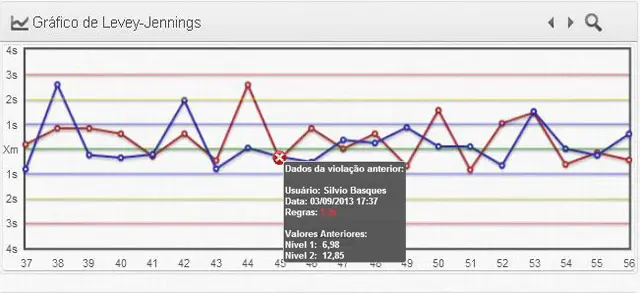
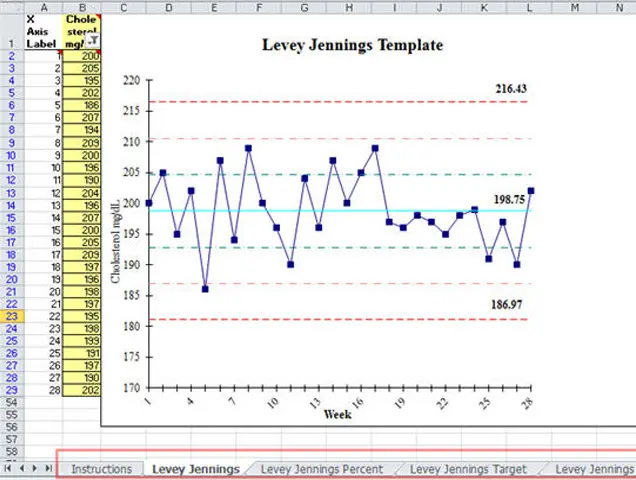
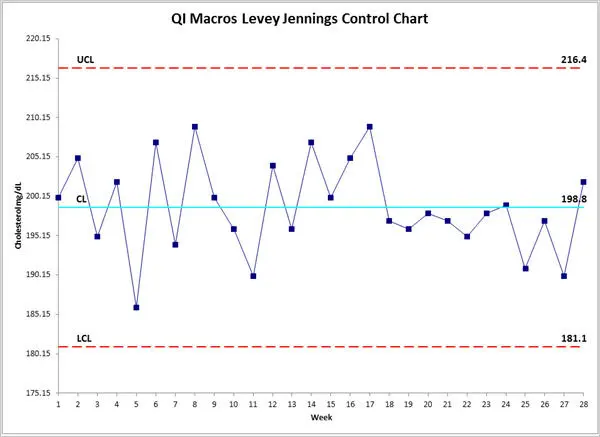
Through my searches on the internet, it was not possible to find an Excel® spreadsheet that does the IQC well. The one I found for this purpose does not have minimal resources: it does not have the possibility of dealing with more than one level of control, it does not have a Levey-Jennings chart with line color patterns, it does not test Westgard's multiple rules and it does not issue automatic alerts — and the professional will not be able to deal with the countless quantitative tests, with records and reports. Anyway, it's good quality pliers, but still pliers.
If you already spend resources on control material and have the trouble of carrying out the analyses, why not complete it with specialist calculation tools for IQC that will actually help you control your systems? Why not use Westgard's rules for better results from your control method? If you adopt well-recommended specialist programs (the right tool), you will be able to count on the participation of your bench assistants, to whom you will delegate functions at the IQC. Your Internal Control will be much more effective.
Why did you think about using a spreadsheet?
To carry out IQC, statistical calculations are necessary, which spreadsheets perform very easily if well assembled. Some IQC scholars realized that they could build spreadsheets that, if well fed with statistical functions, would provide the necessary results to be used to judge the stability of the analytical system, at a low cost. They do not require additional system implementation, since spreadsheet programs are available alongside other office packages.
What was not considered, it seems, is that to perform IQC daily actions are required for numerous analytes and data entry, analysis and reporting processes, for which spreadsheets are not user-friendly. There is then the risk of abandoning control, because the results obtained are insufficient, despite great effort.
If a search is carried out in the National Library of Medicine database — PubMed, the largest database of scientific health information — with the search for the terms worksheet in laboratory quality control, the return shows five citations, which are quite old. In other words, we did not find any indication in recent literature that advocates the use of spreadsheets to support the performance of IQC, in the control of analytical processes in clinical laboratories.
When the only tool we have is a hammer, everything starts to look like a nail.— Abraham Maslow
How are worksheets inadequate?
Spreadsheets are tools for generic applications, which may have little adaptation to specific purposes. Having a specific spreadsheet for IQC, which makes it possible to carry out good control, at up to three levels, with Westgard rules, with Levey-Jennings graphs for dozens of analytes, reports at any time, error assistant, history of non-conformities and other supporting information — all without generating numerous files and a lot of difficulty in accessing and backing up — is a challenge and I haven't found it yet.
Below we list the functions considered essential in a control method — functions that spreadsheets cannot adequately offer.
What should an IQC method have?
Below we list some of the functions considered essential in a control method, so that an IQC capable of bringing real benefits to the team, the laboratory and patients is implemented and maintained.
General ease of use
Access availability
Quick configuration of new inspection lots
Dice entry facility
Flexible use and configuration for multiple rules
Levey-Jennings plot with multiple simultaneous levels
Automatic rule violation flags
Dr. J. O. Westgard et al. described a set of rules applicable to the Levey-Jennings graph, establishing uniform decision criteria to judge the quality of the result of the control run.
Record of actions and corrective measures
Comparison of analytical imprecision with maximum imprecision
Interface with the laboratory IT system
Internal Quality Control Reports
In summary
Does not provide the basic results necessary to verify control status, does not provide confidence in patient results, and does not appear to meet the requirements of accreditation programs.
Using spreadsheets as a method for carrying out Internal Quality Control has the greatest advantage of lower cost. However, it is a fragile, laborious method that is not maintained even for a short time. It does not provide the basic results necessary to verify the control status, does not provide confidence in patient results and does not appear to meet the requirements of accreditation programs.
Observations and declaration of interest
- I am directly involved with a program dedicated to Internal Quality Control, QualiChart, because I created it in the late 1990s and I am a scientific consultant.
- My opinions about spreadsheets come from long experience with these applications and databases, understanding their applications.
- I believe there may be spreadsheets dedicated to Internal Quality Control, which I haven't had the opportunity to see yet.
- Microsoft and Excel are trademarks of Microsoft Co.
Conclusion and Additional Resources
Choosing and implementing an appropriate control method is a step of great sense for the laboratory. It can represent a guarantee that the team has the best tool to carry out control, incorporating concepts and the ability to face problems, facilitating the search for solutions.
Control nonconformities will always occur. It is necessary to be able to count on the right tool for adequate identification, always aiming to increase the ability to detect problems, with the lowest rate of false rejections.
Unlike adapted solutions, a dedicated method is a set of grouped and synchronized functions, bringing together the best characteristics to support the team in internal control tasks. With it, you can count on support and the certainty that there are experts taking care to maintain its functionality, corrections of possible problems, updates according to the evolution of control concepts and much more.
Choosing the appropriate method will be reflected in the medium and long term, with storage and reports, information backup and the guarantee of being able to count on the traceability of your data for the period you need.
Using spreadsheets like Excel is a restricted way, but still a little better than just using evaluation by the manufacturer-assigned range, which is the least suitable method.
Did you like it? Share this content
Published December 2013