The process of critical analysis of nonconformities is the set of steps that the laboratory must follow whenever an error is identified in Internal Quality Control.
Following this process ensures that errors are not just discarded or repeated without investigation — but are handled rigorously, generating effective corrective actions and sustainable analytical stability.
1. Inspect the control chart and rules violated in detail
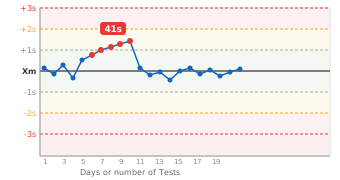
With the visual interpretation of the graph it can be inferred whether there is a trend, which indicates the type of systematic error, or random error.
Levey-Jennings graph interpretation
"Out of Control": Once limits have been established by the laboratory, results beyond these limits may represent a situation out of control.
Increased imprecision: Displayed as increased randomness. When greater than three SD, this distance already indicates the need to reject the analytical run;
Loss of accuracy: Accuracy can be evaluated and its loss noticed when the points leave the expected oscillation around the average and move upwards or downwards.
Trends: It is easily noticeable on the graph, when it points out systematic errors, which have the right direction, that is, more or less.
Identify which rule(s) were violated and classify the error as systematic or random.
2. Analyze possible causes of errors
After classifying the type of error, whether RANDOM or SYSTEMATIC, you must look for the root cause
Systematic errors:
Pointed out by most of the rules, such as 2:2s, 4:1s, 5X, 7X, 7T and 10X. These errors relate to changes in the mean value. Because they have a certain direction and are persistent, their causes are more easily found.
Random errors:
Caused by different factors and having a random characteristic, it becomes more difficult to find the root cause. They can be pointed out by the rules: 1:3s and R:4s. The 1:3s may eventually show a systematic error of great proportion, or magnitude, especially if it is accompanied by an error at another level, in the same direction.
Answer basic initial questions, for example:
- Have the batches and levels been placed correctly in the device?
- In the preparation phase, are the registered values obtained from the material package insert correct?
- Do the measurement units (mg/dl, mMol/l) in the package insert agree with those on the device?
Consult a checklist of causes. Consult histories.
3. Perform interventions on the system to correct the problem
Evaluate and learn about your analytical system and its performance. Review nonconformity histories.
Use records of nonconformities for the analyte as a way of remembering other violations – even old ones – to detect possible recurrences of the same problem. Consider the option of analyzing nonconformities, root causes and corrective measures previously adopted.
Remember the Pareto Principle, which states that 80% of problems have less than 20% of causes. It is a valid axiom for IQC in the clinical laboratory.
Consult the Pareto diagram for the equipment in QualiChart, looking for the most frequent causes of problems with it.
4. Note the measures taken for correction
Adopt and record corrective actions
Having the habit of always recording is a very important behavior for controlling recidivism,
The record of each corrective action provides a source for queries on errors and corrections in that analytical system.
Also make it a habit to write down, for the analytical run, observations about interventions in the system, of other types, such as preventive maintenance, batch changes of reagents, calibrations, needle changes, etc.
Often a simple and apparently innocent intervention can be associated with the cause of the problem encountered.
Use the intervention/maintenance recording routine in QualiChart that is automatically linked to each analyte.
5. Perform new analytical run, for controls and patient samples
If the criterion was to reject the analytical run, a new run must be carried out for all control levels of the rejected run.
If the nonconformity treatment criterion was rejection, you must carry out a new run for all implemented levels, even if the rejection was motivated by just one of them.
The justification is that the analytical run was rejected and consequently all control levels analyzed in that run must be rejected.
Running again is very important and necessary, ALWAYS after analyzing the possible causes.
Especially in the case of random errors, repeating the analysis of controls can, due to the analytical variation inherent to the method, produce 'in control' results without there having been an effective correction of any problem.
6. Test the new data
Your control methods must allow you to enter new values to replace previous ones.
The control method you use (IQC tool) must allow you to enter a new analytical run value if there is rejection. After entering the new values, all enabled rules must be tested and the graph plotted.
The original value, which caused a rule violation, must be preserved in the record and made available for history and review for each analyte.
Only the last approved values should be incorporated into the calculations and graph. Intermediate step values are waived.
Reapply Westgard's rules to the new results and confirm that the analytical system has returned to stability.
7. Interpretation
Interpret the result of the last assessment and decide on referral if the last result is in control (new data).
If the last result is in control, you have the support to consider that patient samples will have analytical quality results if they are treated in a similar way to the control material.
If OUTLIER persists with a second result, you should be even more careful and review the entire system.
You should check the CHECK LIST of error causes and try to open your thinking to look for other possible causes that have not yet been identified.