What the model shows
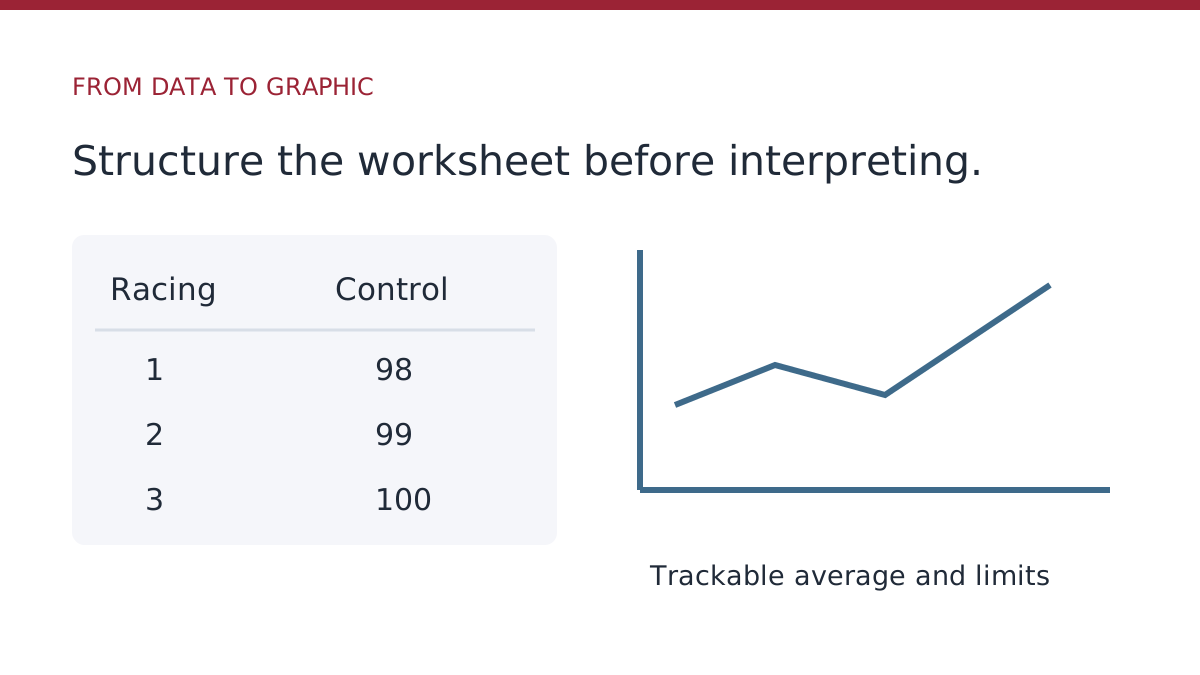
The spreadsheet uses 20 dummy results from a single control level. Calculates sample mean and standard deviation and displays the ±1, ±2 and ±3 standard deviation lines. It is an educational resource, without automated testing of rules and without validation for care use.
How to build in Excel
- Place the run order in column A and the results in column B.
- Calculate the mean and sample standard deviation of the defined set.
- Create columns with the mean and limits mean ± k × standard deviation.
- Insert a line chart that uses run order on the horizontal axis.
- Check units, scale and formulas before interpreting the points.
The file keeps reference values separate from results. Routinely, the definition and change of these values must follow the laboratory procedure; do not automatically adjust thresholds just to accommodate nonconforming results.
What the spreadsheet can't solve alone
Review of formulas, permissions, change history, cross-run rules, and action logging require additional controls. Compare these points in the comparison between spreadsheets and QualiChart.
Receive the model for study
The .xlsx file contains instructions, dummy data, formulas, and graph. Does not contain macros.
Also read the concepts of the Levey-Jennings graph.
Conferences before using the card in routine
Fix mean and standard deviation cell references when copying formulas. Separate data input and calculations, protect formula areas, and validate known results before releasing the file. A visually correct graph can hide a misplaced reference or swapped units.
Use a conference case: mean 100 and SD 2 produce lines at 94, 96, 98, 100, 102, 104, and 106 for −3s to +3s. A result of 107 corresponds to z = 3.5. If the spreadsheet presents another positioning, review the calculation, the origin of the data and the scale of the axis.
Record the approved version, responsible for maintenance and how to restore the file. When changing the batch, concentration or equipment, evaluate whether the previous limits remain applicable. Avoid overlapping periods with different behaviors under a single average without justification.
Beyond the graph: the decision history
The graph shows the behavior of the results; investigation needs context. Reserve fields for observed rules, material conditions, reagent batch, interventions and technical conclusion. When these records are in separate emails or files, test whether someone else can reconstruct the sequence.
If multiple people edit the spreadsheet, set permissions and a major version. Compare the need for manual work with a dedicated IQC system. The purpose of the comparison is to discover which tool keeps data and decisions organized at the scale of your routine.