The IQC Journey: Identifying Mistakes and Critical Analysis
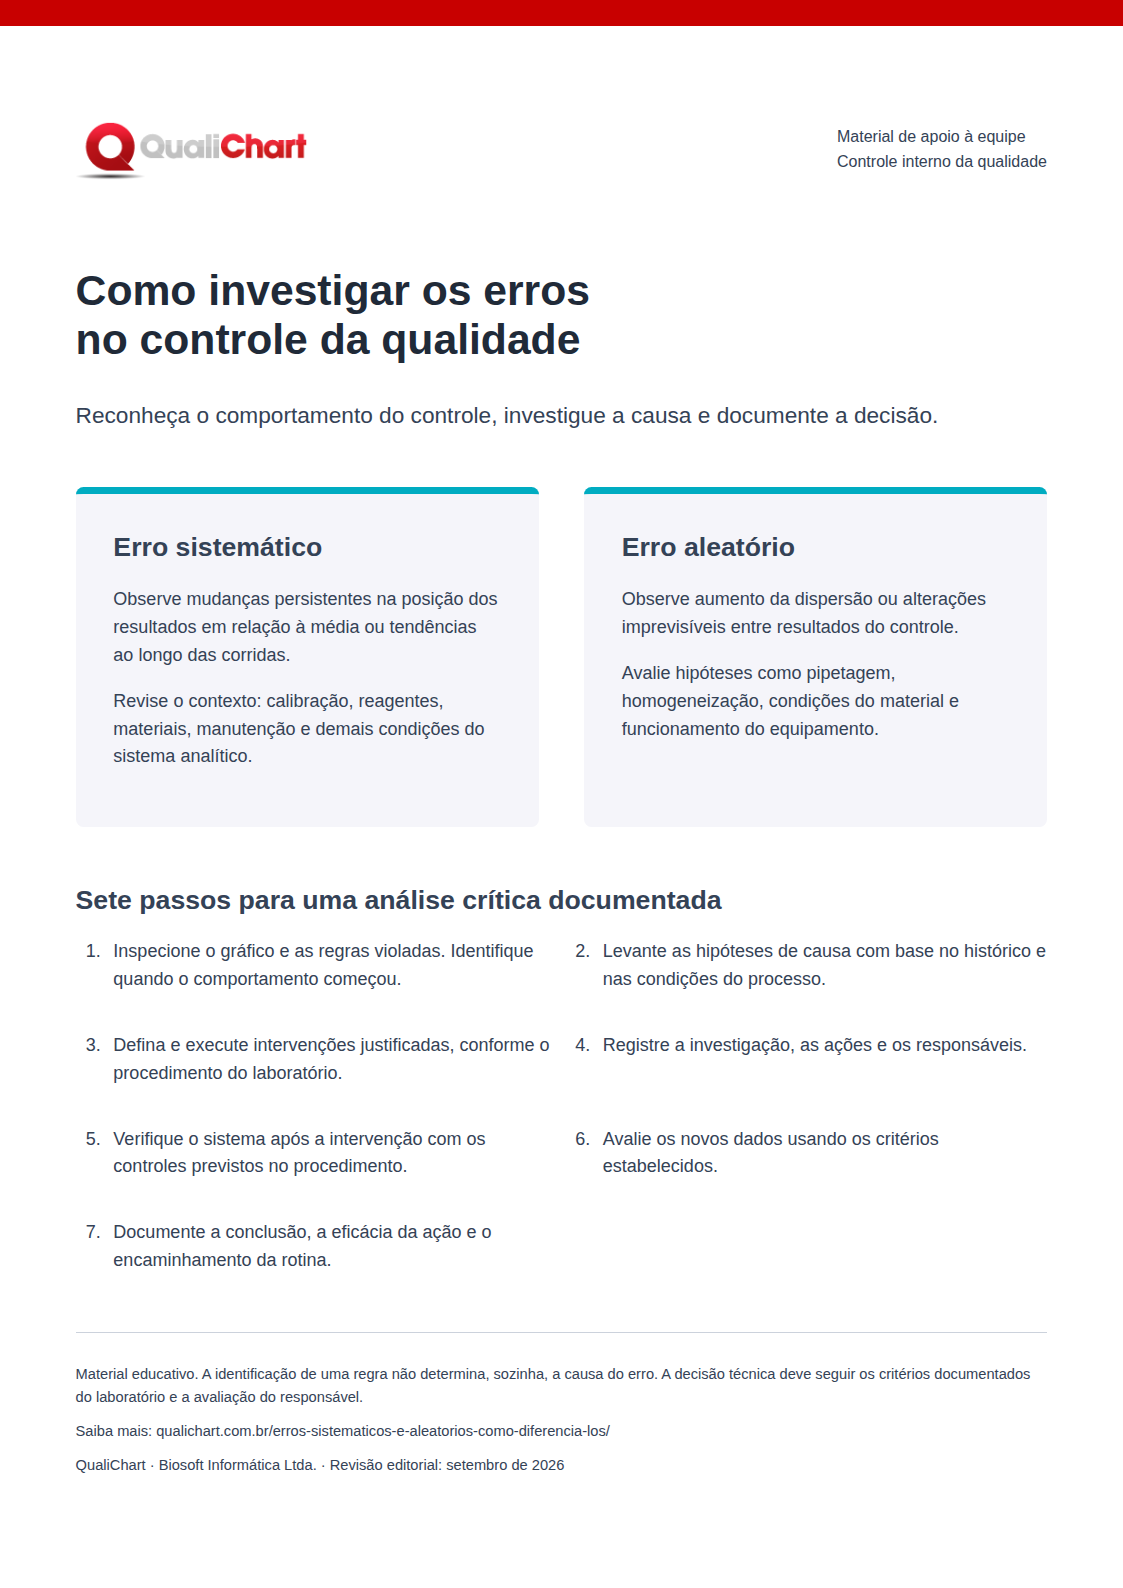
With IQC foundation established and the routine in place, the next step is knowing how to interpret what the data is saying. Correctly identifying errors — whether they are systematic or random — is essential to act accurately and avoid unnecessary repetitions.
Therefore, check out the guide to help you understand the three essential methods for Error Identification and Critical Analysis in Internal Quality Control.
The guide presents in a practical way the use of Westgard's Rules, the Levey-Jennings Chart and the Coefficient of Variation. Very valuable for laboratories that face challenges in carrying out the correct critical analysis and ensuring the safety of the results delivered.
The Journey of Internal Quality Control
"Get from point A to point B"
Follow the steps to implement Internal Quality Control in the clinical laboratory and achieve good stability of the analytical system.
The IQC Journey is a simple-to-follow system, delivering the ideal IQC method for quality managers and laboratory professionals who need to:
- apply the rules for all analytes daily,
- know the errors and make the critical analysis quickly,
- has a stable analytical system, achieving security in releasing results to patients.
In this material we will present the three analysis methods for Error Identification and Critical Analysis in IQC:
Base Construction and Routine
- Planning
- Personal
- Control Material Preparation
Error Identification and Critical Analysis
- Levey-Jennings Plot
- Westgard Rules
- Review
Corrective Actions and System Stability
- Action and Documentation
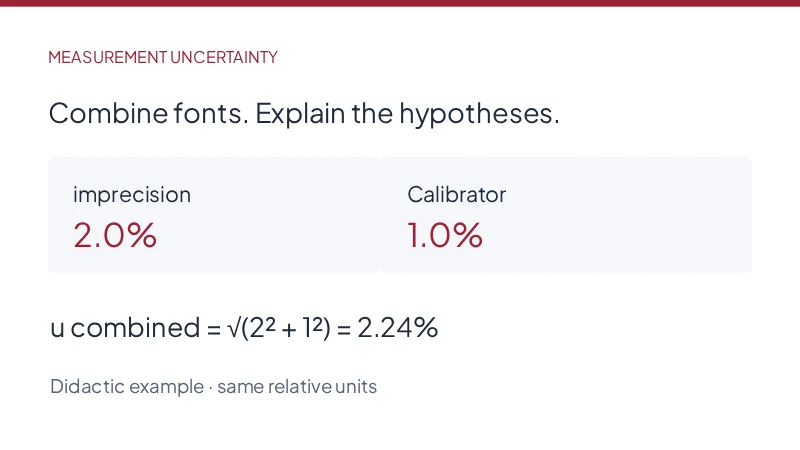
- Measurement Uncertainties
- Maintaining Stability
My Lab Got It…
- Analytical system stability
- Error recurrence control
- Employee engagement
- Daily validation of controls
- Security in releasing results
- Correct interpretation of data
- Complete IQC management
- Plotting graphs quickly and dynamically
- Application of multiple rules for all analytes
- Knowing the calibration time
- Compliance with standards and inspection
My Lab Needs…
- Validate control daily
- Maintain analytical system stability
- Control the recurrence of errors
- Empower people and control turnover
- Graphing speed
- Ensure safe release of results
- Perform critical analysis correctly
- Simplified management of the entire process
- Comply with ANVISA and accreditation requirements
- Know how to apply multiple rules
Identifying Errors
and Critical Analysis
RDC 978/2025 ANVISA
"Art. 180 The Service that performs EAC must perform the IQC for all analytes performed, including:
I – monitoring of the analytical phase by analyzing the control sample, with recording of the results obtained and data analysis;
II – definition of criteria for acceptance and rejection of results by type of analyte and according to the methodology used;
III – release or rejection of analyzes after evaluating the results of control samples;
IV – record of inadequacies, investigation of causes and actions taken for rejected results of control samples;
and V – criteria for evaluating the results of control samples."
The acceptability limit is the criterion that determines whether the control is within the acceptance limits to be validated. To do this, we apply 3 essential analysis methods to check whether the control is acceptable:
- Westgard Rules
- Levey-Jennings Plot
- Coefficient of Variation (CV)
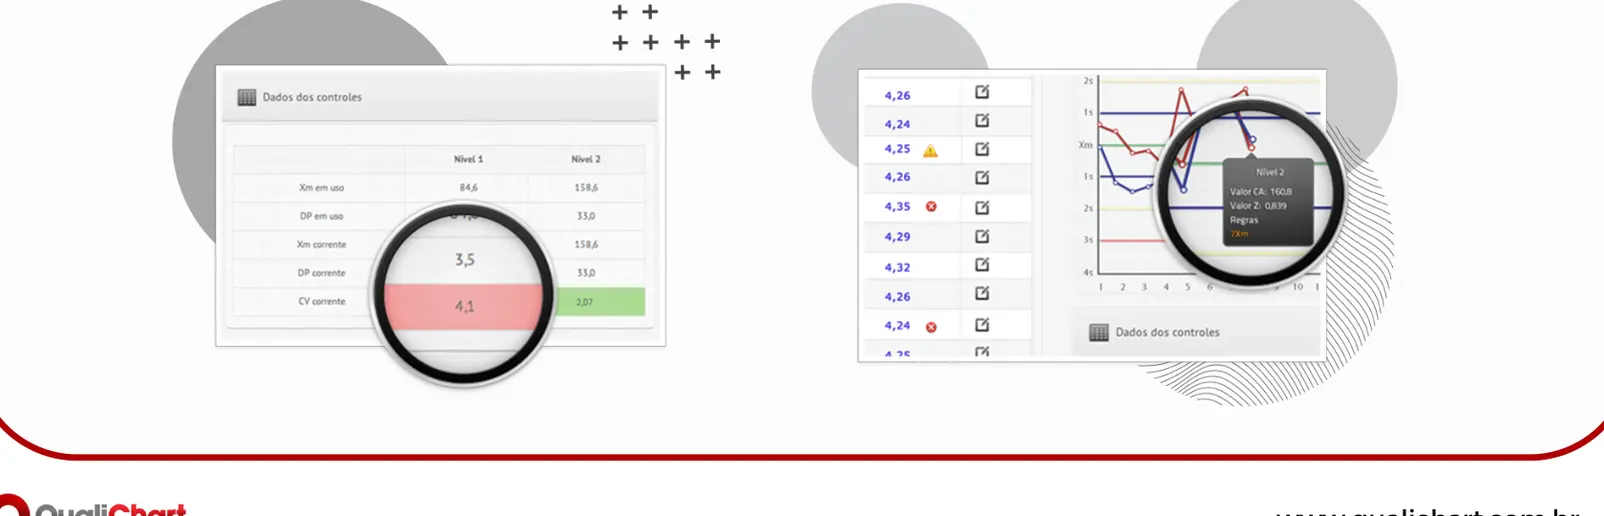
QualiChart automatically performs analyzes in IQC process, reducing 85% of the time spent on the daily control routine.
Westgard Rules — Defining the Rule
Westgard Multiple Rules are used to interpret results in the Internal Quality Control (IQC) system. To this end, a combination of decision criteria is used, with the aim of noticing inappropriate behavior in one or more analytical runs. In general, the most used way to describe the rules is described by Westgard, which is by indicating the number of times a situation occurs and the limit in the control chart.
Therefore, these rules help to understand non-conformities, as well as clarify information about the type of error presented, which can be systematic or random, thus enabling the root cause of the problem to be revealed.
Carrying out the control without using the tool, the professional should follow a sequence of testing the rules, until finding one of them that indicates an error. A heavy job.
With QualiChart, you guarantee the automatic testing of Westgard's rules, that is, it defines the rule for you, generating alerts, classifying the type of error and helping to find the root cause to find a solution.
When violated, the rules point to the type of error, which contributes to understanding the problem and finding the root cause. It is necessary to understand the meaning of the violated rule and the extent of involvement, whether a problem affects only 1 level of control, or more than 1 level, only 1 analyte or more than 1 analyte. By classifying errors into systematic and random, we can better support our reasoning and thus interpret nonconformity.
Systematic errors – are highlighted by most of the rules, such as 2:2s, 4:1s, 5x, 7x, 7T and 10x.
- Because they have the right direction, they are errors whose causes are more easily perceived. Other analytes from the same system may present the same problem.
Random Errors – pointed out by 1:3s and R:4s.
- The 1:3s rule may eventually point to a systematic error of great proportion, or magnitude.
- They can be caused by different factors and, as they are random, it becomes more difficult to find the root cause. Always evaluate the error history of the analyte.
Analysis by Levey-Jennings Chart
The Levey-Jennings Chart is a control chart in which analytical run results are plotted as a function of time or number of runs. It is an important ally of the laboratory professional in internal quality control to evidence the status of the analytical system and help ensure the reliability of the results delivered.
The laboratory performs analysis on control materials and the results are entered and plotted on the Levey-Jennings Chart. Clinical laboratory professionals will be able to identify whether points are within established control limits. The points joined by lines display the different expressions that are of interest to internal control, such as deviations, trends and randomness. One of the advantages of using the chart is that you obtain simple, reliable and effective information.
How to interpret the Levey-Jennings graph
During internal quality control, some error situations may occur. Analysis of the graph is very important for understanding the variability of the results obtained from the materials and can already indicate whether there is a random error or systematic error, even in the preparation phase. At this stage, we seek to define the laboratory's own values, for mean and standard deviation.
See some situations that the Levey-Jennings Chart indicates:
- "Out of Control": Once the limits have been established by the laboratory, results on the graph that are beyond these limits may represent a situation out of control. The criteria for treating these results must also be defined, whether they will be alert or rejection criteria.
- Increased imprecision: It is displayed as an increase in randomness, in which even with results oscillating around the average, the points are very far from it. When greater than three SD, this distance already indicates the need to reject the analytical run.
- Loss of accuracy: Accuracy can be evaluated and its loss noticed in a short time on the graph when the points leave the expected oscillation around the average and move upwards or downwards, indicating a trend. Complementary analysis must be carried out with the results of external control.
- Trends: It is easily noticeable on the graph, when it points out systematic errors, which have the right direction, that is, more or less.
Using QualiChart, you only need to enter the results of the analytical runs. The Levey-Jennings chart is generated automatically, pointing out deviations, trends and randomness in the analytical system.
imprecision analysis using the Coefficient of Variation (CV)
It is essential to critically analyze the performance of the analytical system to identify opportunities to improve measurement quality to obtain lower values for random error. This reduces the imprecision , reducing the total error. The measure of imprecision can be given by the Coefficient of Variation (CV) , calculated by the formula:
CV = SD / Xm * 100
The CV is expressed as a percentage and provides a good estimate of the performance of the analytical method, regarding variability. The CV will be smaller, the smaller the variation in the control results, that is, there will be less imprecision. Therefore, it is an interesting goal for the laboratory to achieve the use of a method that provides a reasonable CV, lower than the maximum desirable imprecision suggested, or indicated by validated sources.
The value for maximum imprecision for various analytes can be found in biological variation tables:
- Westgard Biological Variation Database references
- EFLM Biological Variation Database
QualiChart automatically calculates the mean, standard deviation and Coefficient of Variation of the data entered for all analytical runs, presenting the real variability of your analytical system with the history of month-to-month variability.