Is it appropriate to rely on the range provided by the manufacturer of the control material to assess the performance and stability of your analytical system?
How does the practice take place?
Manufacturers provide in the leaflets for their materials a table with values for each analyte , with the minimum and maximum “desirable” values for the value obtained from the analysis. This encourages professionals to set control limits for their laboratory within the range suggested by manufacturers and understand that this is a good way to carry out Internal Quality Control (IQC) . This understanding that the practice of IQC is sufficient to verify the result and the interval, occurs despite the reservation made by manufacturers in their product documentation. They call attention to the laboratory defining its own mean and standard deviation values, to establish its control limits. They recommend that the values indicated in the leaflet should only be used at an initial stage, as is the general concept for the IQC. Even with this caveat, many professionals still perform IQC only with interval analysis and do not define their own.
Why did you establish yourself this way?
Manufacturers realized the importance of carrying out internal control and decided to include in their product line the control materials, which are of paramount importance. But they faced a question: How would laboratories use these products if they didn't have a way to analyze the results? If parameters for comparison were not provided, how would professionals have references on a daily basis to judge their control results?
Carrying out IQC, an action that is so important for quality, would be unfeasible for laboratories. This is because at that time in Brazil (1990s) there was no calculation tool to save laboratory professionals from the arduous task of carrying out countless daily statistical calculations to obtain the mean value, standard deviation and coefficient of variation, necessary for good control.
We understand that the manufacturers' alternative control materials from around the world, because this strategy is universal, was to establish a range of variation for each analyte. Even with the caveat that laboratories should calculate their own values, the understood ease of judging by the suggested range made professionals incorporate this control method. It looks easy and practical, but it is superficial and inappropriate.
I believe it was thought to be the most appropriate form for that time, but it is not justified today. Manufacturers know that the material will be tested in different analytical systems and in different conditions, very different from theirs, which are kept under control and of excellent quality. In other words, the materials they produce will be treated in often adverse conditions and the chances that laboratories will encounter results that are out of control are high. Perhaps this is why manufacturers established very wide ranges, sometimes accepting variability beyond the maximum imprecision recommended by the literature.
This “slack” offered by the wide ranges seems comfortable for the laboratory and helps in some way with control, but it does not help in achieving good IQC. On the other hand, encouraging laboratories to adopt the label values only in a first phase, to calculate their own mean and standard deviation values would require the suggestion of a calculation tool, which was not available in the 1990s. Today the reality is different. Although the disclosure of intervals for each analyte is a practice adopted by manufacturers around the world, modestly our understanding is that it is necessary to evolve so that the laboratories can actually implement and carry out control.
Do I perform good internal control if I follow the manufacturer's stated range?
You do carry out some control, but is far from being Internal Quality Control in its proper form .
Using this method, the laboratory already spends a significant amount of time and money on the materials it consumes and on personnel. But analyzing it this way, this investment does not obtain the desired result for the Internal Quality Control.
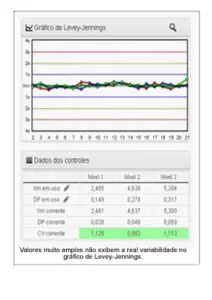
A simple example, even though you have already invested in control materials and personnel, when using a wide range, you may sometimes not notice the need for calibration, or another problem that increases its variability.
And in this way, may improperly accept results for controls that may compromise the results of patients, notably at borderline values.
You don't realize it's poor quality.
What do I need to have in my IQC that the manufacturer's stated range DOES NOT give me?
Some important items that you miss when using the manufacturer's stated range:
-
Calculation of Mean, Standard Deviation and Coefficient of Variation;
-
Do not find trends and other changes by creating and analyzing the Levey-Jennings graph;
-
Comparative analysis of laboratory imprecision, measured by the Coefficient of Variation;
-
Tests of multiple IQC rules, the Westgard Rules that indicate the need for action according to the type of error found;
-
More suitable analysis data when e.g. ex. the analytical system is compromised at a pathological level and is not at a normal level;
-
Recording and analysis day after day as data is not noted down effectively;
-
Recording significant information about important occurrences in the systems;
-
In addition to not normally creating and storing Internal Quality Control Reports required by Health Surveillance.
Could the manufacturers have done things differently?
In a way yes, but any action in this direction would imply a loss of focus. Its mission is to produce reagents and control materials and guarantee their quality to be used as a reference for IQC. Calculation instruments for day-to-day life in laboratories are not their objectives and that is why they adopted the simple way of indicating intervals. There are those who suggest electronic spreadsheets, which are a way to increase gains in the treatment of results obtained on the bench with the analysis of control materials. Spreadsheets are excellent generic calculation tools, but they are not suitable for IQC because they do not provide the necessary results, such as those provided by dedicated programs. Some manufacturers offer dedicated programs, for users who purchase their control materials.
Levey-Jennings Chart: Indispensable in control
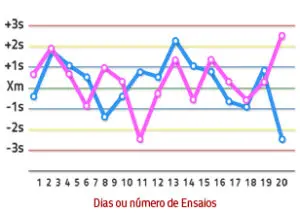
The Levey-Jennings Chart is a control chart in which the results of the analytical run are plotted as a function of time, or number of runs.
One of the advantages of using the chart is that you obtain simple, reliable and effective information, which unfortunately, through manufacturer's stated range, cannot be obtained.
He is an important ally of laboratory professional, no internal quality control, to highlight the status of the analytical system and help ensure the reliability of the results delivered. Levey & Jennings introduced this application in 1950, based on a control chart used in industry since 1931, when it was created by statistician Walter A. Shewhart, who created Statistical Process Control. Levey-Jennings' contribution, this important tool for the laboratory, was later improved by Henry and Segalove, who used the limits of ±3 standard deviations, based on analysis of long-term series.
Statistical Process Control is the basis for modern Internal Quality Control (IQC). The laboratory performs analysis on control materials and the results are released and plotted on the Levey-Jennings Chart. Clinical laboratory professionals will be able to identify whether points are within established control limits. The points joined by lines display the different expressions that are of interest to internal control, such as deviations, trends and randomness.
In summary
Perform Internal Quality Control by evaluating the result compared to the range provided by the control material manufacturer is a method, but it is not a good control and it's not enough. The manufacturer-assigned values are only useful at a stage in which the data of the laboratory.
The control chart is a valuable instrument in IQC. To use it, the professional must look for practical and feasible ways, with clear results that can be shared by everyone involved with the analytical steps.
If you want to know more about how to generate the graph automatically, click here and learn about Qualichart.
Calculation tools help organize control and its records. Evaluate how fits into the process defined by the team and the current requirements applicable to the IQC . The tool does not guarantee compliance by itself.