For Quality Manager in the Clinical Laboratory
Only by analyzing these items together is it possible to understand the errors and know what decision to make to correct the deviations. The material contains the three crucial interpretative elements to detect and understand changes in the stability of the analytical system that result in increased imprecision in the laboratory.
The three crucial analyzes for detecting changes in the stability of the analytical system. The quality manager needs to know how to apply and analyze these items within IQC routine.
Using a tool to perform IQC can automatically generate the Levey-Jennings graph, apply Westgard's rules for all analytes and compare the CV with reference tables, reducing the time spent on the daily control routine by more than 85%.
1 — Visual Interpretation of the Levey-Jennings Chart
The values obtained from analyzing the material on the bench are recorded to be displayed on the graph, successively.
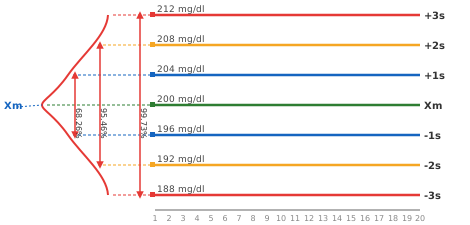
- Results out of control
- Increased imprecision
- Trends
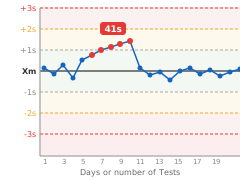
- Systematic error
- Random error
2 — Analysis by Multiple Internal Control Rules
(Westgard Rules)
The rule was identified, whether statistically or systematically, making it possible to check whether there are random or systematic errors
Errors identified: Sample may indicate many parts of the rules, such as 2/2 or 10x. Random errors: Caused by different factors or sample characteristics. Systematic errors: Constant departure from the true value
Have tests and calibrations been performed?
In the prepared workbench, are the values correct?
Are calibrations of device measurements in the laboratory for the device?
3 — Comparison of CV with Maximum imprecision Values
Calculate the CV (CV = SD / Xm * 100) to know the uncertainty of the measurements, detecting the laboratory's analytical imprecision.
The CV will be smaller, the smaller the variation in the control results, that is, there will be less imprecision.
As a comparison criterion: adopt the variation tables:
• Westgard Biological Variation Database references
• EFLM Biological Variation Databank
Examples of interpretation of Levey-Jennings graphs for internal control:
NOTE: Level 1 data, in pink; level 2, in blue. CV = Coefficient of Variation; N1 = level 1; N2 = level 2
Analytical system: Sodium - Ion selective electrode
Features: Automation - Automatic Calibration - Two-level IQC
CV: N1=2.5% | N2=2.0%
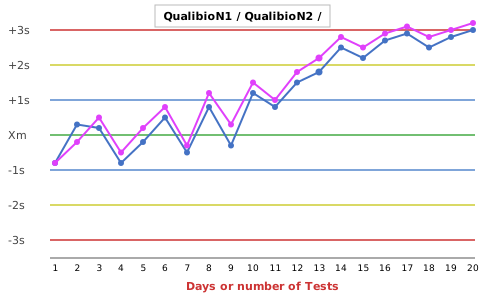
Rules Violated:
Trend up to 1:3s – increase of both levels – Systematic error.
Probable causes:
Electrode contamination, controls dehydration, calibrator problem.
Corrective measures:
Electrode cleaning and new calibration.
Analytical system: Glucose - Enzymatic
Features: Automation - IQC on two levels
CV: N1=4.37% | N2=3.24%
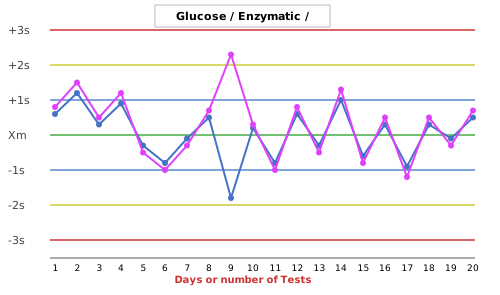
Rules Violated:
R:4s – Random error. In test 9: N1 above +2s and N2 below -1s on the same day → amplitude between the two levels = 4.1s. The R:4s rule is applied WITHIN the same trial (never between consecutive trials).
Probable causes:
Change of bottles. Probable human process failure or serious equipment irregularity.
Corrective measures:
Checking the equipment, reviewing the control procedure and reprocessing the bottles.
Analytical system: Creatinine - Enzymatic
Features: Automation - Dry Chemistry - IQC two levels
CV: N1=6.74% | N2=3.39%
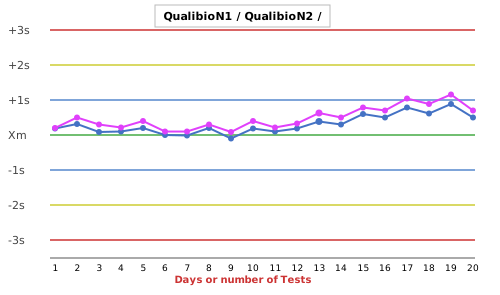
Rules Violated:
8x (without violating 1:2s) – Systematic error. 8 or more consecutive points on the same side of Xm, without exceeding ±2s.
Probable causes:
Change of reagent slide generation/batch (VITROS® MicroSlide). Degradation of reagents, variability in slide layers or change in equipment calibration.
Corrective measures:
Check batch number of slides. Validate equipment calibration. Compare results with the reference method. Adjust the control average if a change in methodology is confirmed. The different CV (N1=6.74% vs N2=3.39%) suggests instability at one level - investigate specific reagent stability.
Analytical system: Alkaline Phosphatase
Features: Automation, IQC two levels
CV: N1=18.3% | N2=6.8%
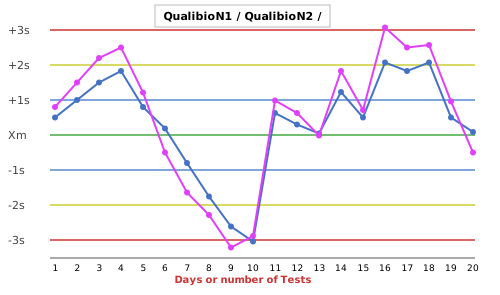
Rules Violated:
2:2s - Systematic error. Two consecutive results exceed the SAME ±2s limit (both above +2s OR both below -2s). Visible at points 3-4, 9-10 and 17-18.
Probable causes:
Degradation of VITROS MicroSlides (dry chemistry). Dry reagent instability or contamination. Equipment automation failure (pump, optical sensor, temperature). Offset or expired calibration for Alkaline Phosphatase.
Corrective measures:
CV N1=18.3% is CRITICAL (unacceptable) – Indicates severe loss of control at this level. Check: (1) MicroSlide batch/validity; (2) Storage conditions (temperature); (3) VITROS calibration with primary standard; (4) Compare with second reference method; (5) Inspect dry layers of the slide. Reject results and investigate before releasing. The CV of N2=6.8% is also high – it suggests a systemic problem in the equipment, not just at one level.
Analytical system: Urea - Enzymatic
Features: Automation - IQC on two levels
CV: N1=12.9% | N2=5.4%
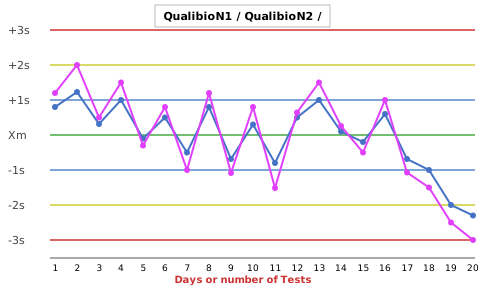
Rules Violated:
2:2s with deviation to MINUS (underestimation). Two consecutive results (points 19-20) fall abruptly below -2s at both levels, indicating systematic error after recalibration.
Probable causes:
Occurred after calibration with a new batch of calibrator. Programming error: BUN (Blood Urea Nitrogen) value incorrectly entered into the equipment. The new calibrator batch was not entered correctly or its traceability was lost.
Corrective measures:
Correct the calibrator value on the equipment. Check whether the value was reported in BUN (blood urea nitrogen) when it should be in Urea, or vice versa. CV N1=12.9% (high) and N2=5.4% (moderate) indicate good precision separation between levels, but both need to be corrected. Revalidate with a new batch of calibrator after correction. Urea/BUN results should not be released until this issue is resolved.