
The IQC Journey: Corrective Actions and System Stability
After establishing IQC foundation and mastering the control routine, the next step is knowing what to do when the control fails. Identifying the type of error, investigating the root cause and implementing effective corrective actions are fundamental to maintaining the stability of the analytical system.
Therefore, check out the guide to help you understand the practical process of Corrective Actions and Analytical System Stability in Internal Quality Control.
The guide presents a practical step-by-step guide to dealing with errors in Internal Control, very valuable for laboratories that face challenges in maintaining the stability of the analytical system, carrying out the correct critical analysis to guarantee the safety of the results delivered.
The Journey of Internal Quality Control
"Get from point A to point B"
Follow the steps to implement Internal Quality Control in the clinical laboratory and achieve good stability of the analytical system.
The IQC Journey is a simple-to-follow system, delivering the ideal IQC method for quality managers and laboratory professionals who need to:
- apply the rules for all analytes daily,
- know the errors and make the critical analysis quickly,
- has a stable analytical system, achieving security in releasing results to patients.
In this material we will present a practical guide focused on Corrective Actions and Analytical System Stability:
Base Construction and Routine
- Planning
- Personal
- Control Material Preparation
Error Identification and Critical Analysis
- Levey-Jennings Plot
- Westgard Rules
- Review
Corrective Actions and System Stability
- Action and Documentation
- Measurement Uncertainties
- Maintaining Stability
My Lab Got It…
- Analytical system stability
- Error recurrence control
- Employee engagement
- Daily validation of controls
- Security in releasing results
- Correct interpretation of data
- Complete IQC management
- Plotting graphs quickly and dynamically
- Application of multiple rules for all analytes
- Knowing the calibration time
- Compliance with standards and inspection
My Lab Needs…
- Validate control daily
- Maintain analytical system stability
- Control the recurrence of errors
- Empower people and control turnover
- Graphing speed
- Ensure safe release of results
- Perform critical analysis correctly
- Simplified management of the entire process
- Comply with ANVISA and accreditation requirements
- Know how to apply multiple rules
Corrective Actions and
System Stability
Step-by-step guide to dealing with errors in Internal Control
Investigate and have a standard questionnaire to define corrective attitudes, for example:
- Have the batches and levels been placed correctly in the device?
- In the preparation phase, are the registered values obtained from the material package insert correct?
- Do the measurement units (mg/dl, mMol/l) in the package insert agree with those on the device?
Inspect the control chart and rules violated in detail
Visual interpretation of the control chart can be very enlightening. We can infer whether there is a trend, which indicates the type of systematic error or whether the distribution of points suggests a random nature. Violated rules also provide important indicators of the type of error.
Rules that evaluate consecutive control observations, such as 2:2s, 4:1s, 7x, 10x and 7T usually indicate systematic error. Rules that test for broadening of the Gaussian distribution of control measurements, such as 1:3s, R:4s generally indicate random error.
The control chart is a visual representation of the variability of results obtained from material analysis. Figure 1 shows the conjugation of images of the Gauss curve.
Let's discuss each curve separately and what it indicates.
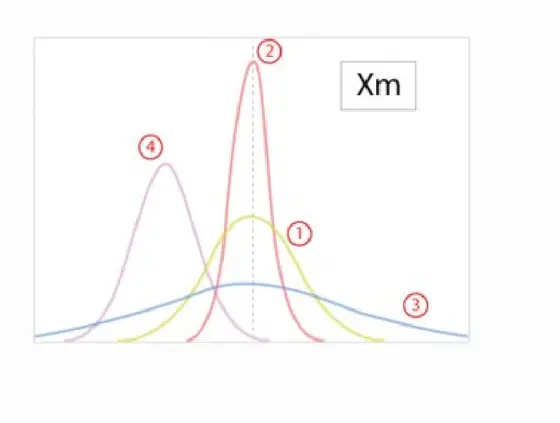
Curve 1 – green – shows a Gaussian distribution of results, in an acceptable way and with an appropriate average. The coefficient of variation would be at values less than the maximum imprecision allowed for the test.
Curve 2 – red – very good variability (small), showing distribution of values closest to the average. The CV should be comfortably below the maximum allowable imprecision.
Curve 3 – blue – the Gaussian distribution appears wide, indicating very dispersed results, even though they remain equidistant from the average value. Indicates increased random errors.
It is good control practice to always inspect the Levey-Jennings chart. The practice of simply comparing the result of the run with a range recommended by the manufacturer of the control material is a fragile criterion with a low rate of problem detection. Analyzing the control chart, or testing the rules, reveals the problem you can solve. This is what is expected from an accurate and early control system.
Analyze possible causes of errors
Once the type of error has been identified, whether random or systematic, look for the root cause. Systematic errors are more frequent, caused by persistent problems and are easier to resolve. Random errors do not have a defined meaning or direction, and are therefore more difficult to find the root cause.
Remember to check the last movement in relation to the device (recent maintenance), reagent (new reagent, new batch), calibration, etc. Use information about types of errors, in a list, to remind you of the possibilities. Carry out an accurate review of the causes of error. Spend a little time on the analysis, to save on time and materials, avoiding fruitless repetitions that increase your costs.
Mainly evaluate two aspects:
- If the problem affects other tests that are run on the same device — this is what we can call the "common denominator" for the different analytical systems.
- If there has been recent intervention on the equipment, from preventative maintenance, any damage, to changing reagents.
Perform interventions on the system to correct the problem
Evaluate and learn about your analytical system and its performance. Use records of nonconformities for the analyte as a way to recall other violations — even old ones — to detect possible recurrences of the same problem. Consider the option of analyzing nonconformities, root causes and corrective measures previously adopted. Remember the Pareto Principle, which states that 80% of problems have less than 20% of causes. It is a valid axiom for IQC in the clinical laboratory.
Avoid simply replacing the bottle of control material or using a new reagent, which may supposedly give faster results, in fact, it may be that you are just postponing effective measures. However, it is always possible that an analyte has deteriorated in a control material during use, and by analyzing another vial the solution to the problem can be found, which in this case would be in the material that has the function of controlling the stability of the system, but which itself would have lost stability. This deterioration may be caused by poor conservation of the control material.
Note the measures taken for correction
Having the habit of always recording is of great importance. Only then will you be able to better solve future problems with the same analytical system, as advocated in the previous item. In automated systems, such as QualiChart, look for the registration form in 'Comments', or 'Observations' in the analytical run, to note the interventions, or also write down some other type of information relating to the analytical system, some comment.
Recording each corrective action will provide you with a source for queries about errors and corrections in that analytical system.
You may find it appropriate to repeat a previously adopted corrective measure that was successful. Also, for the analytical run, make it a habit to write down observations about interventions in the system, of other types, such as preventive maintenance, batch changes of reagents, calibrations, needle changes, etc. Often a simple and apparently innocent intervention can be associated with the cause of the problem found. Those who carry out quality control only with the equipment's own module have to make these notes in separate records, which is always more laborious.
Perform new analytical run, for controls and patient samples
If the criterion was rejection of the analytical run, a new run must be carried out for the control levels of the analyte(s), after having taken rationally defined steps to review the analytical system and correct any problems found. This repetition is not meaningless, because it aims to verify whether the measure adopted was in fact sanitary and resolving. If the problem factor remains, it will continue to negatively influence the results of controls and would also influence those of patients. Without a careful assessment of the root cause and appropriate corrective measures, repetition will only delay the identification of problems and the effective application of corrective measures.
With simple and automatic repetition, without a rational basis for evaluating the cause, you are saying that you do not trust that the control system fulfills its role of being able to detect problems. Especially in the case of random errors, repeating the control analysis can, due to the analytical variation inherent to the method, produce 'in control' results without there having been an effective correction of any problem.
Running again is very important and necessary, ALWAYS after analyzing the possible causes.
Test the new data
The control method you use must allow you to enter a new analytical run value, replacing the previous ones, if there is rejection. With QualiChart, for example, the process of calculating and recording history is done automatically.
After entering new values, all enabled rules must be tested and the graph plotted. The original value that caused a rule violation must be preserved in the record and made available for history and review for each analyte.
The value that caused the violation remains archived, but is not used for calculations of current values, for interpretation of the Coefficient of Variation. This is because you adopted the rejection criteria for the run, and must include new data that will be judged and possibly accepted. Archiving the data that generated the non-conformities serves to document the IQC performance and in subsequent reviews, to guide reasoning about recurrences of the same problem.
If a problem is recurring, you must take care to establish a subsequent analysis procedure to adopt preventive measures. Consider holding a discussion with the equipment's technical consultant, or with the reagent manufacturer's SAC.
Interpret the result of the last assessment and decide on referral
It is very important that the solution to the problem did not occur by chance, but rather as a result of your intervention in the system. If the last result is in control, you have the support to consider that patient samples will have results of analytical quality if they are treated in a similar way to the control material.
If OUTLIER persists with a second result, you should be even more careful and review the entire system. You should check the CHECK LIST of causes of errors and try to open your thinking to look for other possible causes that have not yet been identified. If you use an IQC system such as QualiChart, you can activate the program's Error Assistant to receive assistance in finding the causes.
Whenever contacted by its employees in a situation of persistent nonconformity, the Quality Manager must analyze the problem, adopting a systemic view of the analytical process, with criteria:
- Must inspect the control chart, the rules violated and the type of error, whether random or systematic. Systematic errors show trends — changes that occur gradually over time. Random errors point to greater variability in the system, and mean a broadening of the distribution curve of control results, or the Gauss Curve;
- Relate the type of error with the potential causes. Systematic errors and random errors have different causes. Problems that cause systematic errors are more common than those that cause random errors;
- Must consider other analytes in multiple test system. If there are also problems with these others, the analysis must continue in relation to the characteristics of the tests, the equipment, the filters, lamp, that is, what could be in common;
- Relate the problem to recent interventions. Systematic errors are often related to reagent and calibration problems. A marked deviation from the mean may be due to reagent change, lot change, recent calibration, calibrator lot change. These are interventions that, when carried out, must be noted in the internal control method (computer program), to guide root cause analyzes of nonconformity;
- Record measures taken. Always register, so you can consult later. Note the corrective measure in an appropriate place, if it was indeed a factor in the solution.